


Debug web screens where devtools can't reach.
In-app webviews, in-app browsers (KakaoTalk, Instagram, Line), kiosks, TVs, security-hardened
builds — the places where chrome://inspect shows nothing and Safari's Develop menu stays
empty. crosspane gives those screens a console, a network log and a shareable capture file.
⚠️ Beta — APIs and CLI flags may change between minor versions until 1.0. Bug reports and feedback are very welcome — please open an issue.
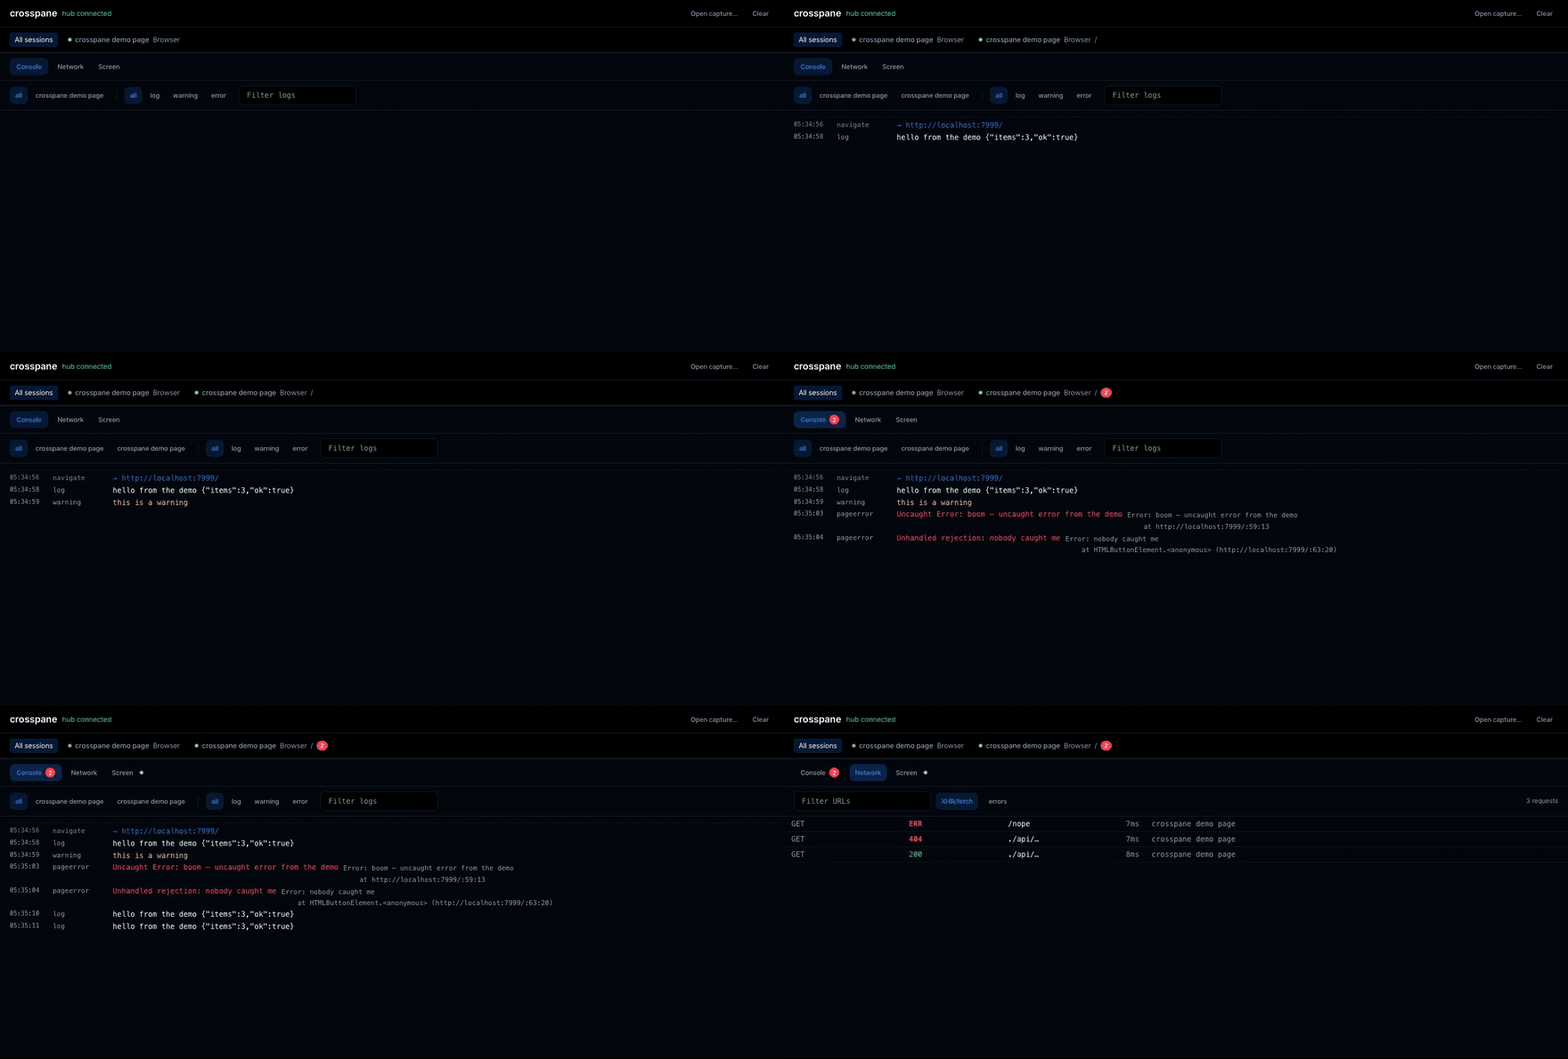
A page with no devtools access, streaming its console and network activity to the dashboard.
your app (dev/QA build)                 your machine
┌──────────────────────────┐            ┌──────────────────────────┐
│  @crosspane/agent        │  live WS   │  crosspane hub           │
│  console · errors        │ ─────────► │  dashboard on :7788      │
│  fetch/XHR · navigation  │            │  console · network       │
│  crash-resistant buffer  │            │                          │
└──────────┬───────────────┘            └──────────────────────────┘
           │  export .crosspane.json  ──────────►  drop into the dashboard
           │  (no network needed — works behind ISMS-P / MDM locks)
Two ways to get the data out, because networks aren't always available:
- Live — the agent streams to the hub (your LAN by default, or through a tunnel or your own origin), you watch in real time, and can save any session to a file from the dashboard
- Offline — the agent keeps the last N events in a ring buffer; export one JSON file, send it to a developer, replay it in the same dashboard
1. Run the hub
npx crosspane # dashboard on http://localhost:7788It tells you where to look and, once a page connects, what it is streaming:
crosspane dashboard → http://localhost:7788
● session · checkout webview  https://staging.example.com/pay
So you know the page found the hub without opening the dashboard — the thing you most want to know when nothing shows up. The dashboard itself is in English or Korean, following your browser and switchable in the header.
2. Add the agent to your app (dev/QA builds only — see Shipping safely)
npm install @crosspane/agentCall it once, as early as your app can run code. Anything that happens before the call is not hooked — requests are partly recovered from resource timing afterwards, but console logs from before the call are gone for good. So it belongs at the top of your entry point, above your own imports, not inside a component that mounts later.
| Your setup | File | Where in it |
|---|---|---|
| Next.js (App Router) | a new app/crosspane.tsx with 'use client', imported from app/layout.tsx |
top level of that module — see below |
| Next.js (Pages Router) | pages/_app.tsx |
top of the file, outside the component |
| Vite (React/Vue/Svelte/Solid) | src/main.ts / src/main.tsx |
first lines, before createApp / createRoot |
| Create React App | src/index.tsx |
first lines, before createRoot |
| SvelteKit | src/routes/+layout.svelte |
inside <script>, guarded by browser |
| Astro | your base layout's <script> |
before other scripts |
| No bundler | a <script> in <head> |
before your other scripts — see the agent README |
// src/main.tsx — Vite, CRA. First lines of the file.
import { initCrosspane } from '@crosspane/agent'

initCrosspane({
  label: 'checkout webview',
  serverUrl: import.meta.env.VITE_CROSSPANE_URL,   // omit entirely on localhost
})

// ...your own imports and createRoot() below
Next.js App Router needs one extra step. app/layout.tsx is a server component: calling
initCrosspane() there runs it on the server, where there is no page to hook — it does not
crash, it just silently does nothing, which is harder to notice than a crash. Put it in a
client module instead:
// app/crosspane.tsx
'use client'
import { initCrosspane } from '@crosspane/agent'

// Top level, not inside the component and not in useEffect — a module runs as soon as the
// client bundle loads, while useEffect waits for React to mount and misses your early logs.
initCrosspane({
  label: 'checkout webview',
  serverUrl: process.env.NEXT_PUBLIC_CROSSPANE_URL,
})

export function Crosspane() {
  return null
}
// app/layout.tsx — render it once, anywhere inside <body>
import { Crosspane } from './crosspane'Calling initCrosspane() twice is safe — the second call returns the same agent rather than
hooking anything again — so a hot reload or a double-mounted layout won't duplicate events.
Offline capture works the same everywhere; wire it to a debug gesture or a hidden QA menu:
const agent = initCrosspane({ label: 'checkout webview' })

// In a webview, prefer copyCapture() — downloads often fail silently there
// (see "Getting captures off a locked device")
agent.exportFile()   // downloads <label>.crosspane.json
That's the whole setup on localhost — the agent finds the hub by itself, so you can leave
serverUrl out entirely. For every other environment you set that one env var and nothing else
changes: see One setup for every environment.
Pass the env var through serverUrl as the examples do, rather than letting the agent read
it on its own. Both work on localhost, but only the explicit one connects when you open the
page from a phone at http://<your-lan-ip>:3000 — an env var can be baked in by CI, so an
address the agent picked up by itself needs a per-device opt-in before it will stream anywhere
but localhost. Handing it to serverUrl is you saying it out loud, so no opt-in is asked for.
agent.live tells you an address was resolved — not that the hub answered. It is true
even when nothing is listening there. To see whether sessions actually arrive, watch the hub's
terminal: it prints ● session · <label> the moment a page connects.
3. Reproduce the bug. Console logs, uncaught errors, unhandled rejections, failed requests and navigations show up in the dashboard — or in the exported file.
The only thing that differs between localhost, a phone on your Wi-Fi, a deployed staging URL and production is how the page reaches your hub. Give it one address that works from all of them and there is nothing else to vary.
initCrosspane({
  label: 'checkout webview',
  serverUrl: process.env.NEXT_PUBLIC_CROSSPANE_URL,  // Vite: import.meta.env.VITE_CROSSPANE_URL
})
NEXT_PUBLIC_CROSSPANE_URL=https://crosspane.example.com
Just the address, like any other base URL — nothing appended, and the same value is fine in every environment including production. Sending sessions needs no credential; reading them needs a token that never leaves your machine, which is why a page source anyone can read gives nothing away.
For a deployed page — a staging URL on your phone — one flag:
crosspane --lan-tlsThe hub serves https://<your-lan-ip-with-dashes>.local-ip.sh:7788 with a certificate devices
already trust, so an https:// page on the same Wi-Fi can reach your laptop. Put that address
in the env var above. No tunnel, no account, nothing installed on the device — measured on a
real Android phone against a deployed site, with no permission prompt shown. Read the trade-offs
under "If you can't route logs through a tunnel" below before you rely on it.
For a hub reachable from anywhere — a teammate's network, CI, a device that isn't on your Wi-Fi — use a tunnel instead:
crosspane --tunnel --write-envThat starts a tunnel with your installed cloudflared or ngrok, advertises its address, and
writes it into .env.local for you — so during local and on-device development there is nothing
to copy at all. Stop the hub and the tunnel and the env entry go with it. Session logs transit the
tunnel provider, which is why it's an explicit flag; crosspane never downloads a binary for you.
For a deployed app the address goes into your deployment config, so it must not change. Add a hostname and crosspane sets the permanent tunnel up for you:
cloudflared tunnel login                                        # once, opens a browser
crosspane --tunnel --hostname crosspane.example.com             # every day
The second command creates the named tunnel, routes DNS to it and runs it — and it's idempotent,
so it's also the command you run tomorrow. Your deployment config keeps
https://crosspane.example.com forever.
Only the login can't be automated: a permanent public hostname belongs to an account somewhere, and
that account needs a browser once. (Measured while looking for a way around it: ngrok's free plan
refuses custom subdomains outright — "Only paid plans may create endpoints with custom
subdomains". Tailscale Funnel gives a stable *.ts.net with no domain at all, if you'd rather not
use Cloudflare; point --public-url at it.)
By default every install with that address streams. That's what you want in a dev or QA build. If
the same build reaches people you don't want sending you logs, gate it on something your app
already knows — with enabled: false the agent installs no hooks at all:
initCrosspane({ serverUrl: HUB, enabled: () => user.isQA })A feature flag, an internal-account check, a toggle in a hidden debug menu — anything. This is the right gate for a webview the app opens itself, which is most of what this tool is for: there's no address bar in one, so nothing URL-based can work there.
If the page has no user model at all (a static site, a kiosk), isDebugActivated gates on a link
instead — open the page once with ?__crosspane=on and that device streams until
?__crosspane=off:
import { initCrosspane, isDebugActivated } from '@crosspane/agent'
initCrosspane({ serverUrl: HUB, enabled: isDebugActivated })
agent.live tells you which state you ended up in.
If you can't route logs through a tunnel
A tunnel is one flag but it does send session logs through a third party, which some teams can't accept. Any of these replaces it, and the app-side code above does not change — only the address:
| how | trade-off | |
|---|---|---|
| A team hub | run the hub on real infrastructure with a normal certificate | nothing transits anyone else; needs somewhere to run it |
| Your own certificate | crosspane --host 0.0.0.0 --tls-cert cert.pem --tls-key key.pem |
nothing leaves your network — but only works when the page is on that network too (an internal staging site, say). A page served from the public internet can never reach it, certificate or not |
| Reverse proxy on your origin | crosspane --public-url https://staging.example.com/__crosspane, and point that path at the hub |
same origin, no third party; needs one route in your app server, forwarding the WebSocket upgrade |
| Plain HTTP on your LAN | crosspane --host 0.0.0.0 --write-env |
simplest, and right for a dev server you open from a phone on the same Wi-Fi. A deployed page can't use it — see below |
| No network at all | agent.copyCapture() |
unaffected by addresses, certificates and origins; the main path on a locked-down build |
A deployed page reaching a hub on your LAN is a permission, not a prohibition. Chrome answers
LocalNetworkAccessPermissionDenied — and local-network-access is a real permission whose state
is prompt in an ordinary browser, like camera or microphone. Measured with that check lifted and
nothing else changed: https://example.com → wss://<lan-ip>.local-ip.sh/agent delivered a session
and a console event to the hub, over a genuine Let's Encrypt certificate.
--lan-tls is that path, in one flag — it implies --host 0.0.0.0, since reaching the hub from
another device is the whole point:
crosspane --lan-tlsKnow what you're getting before you rely on it:
- Browsers ask once; in-app webviews don't. Chrome shows a local-network permission prompt — allow it. Inside an Android WebView (which is what KakaoTalk, Instagram and Line in-app browsers are) Chrome currently grants Local Network Access unconditionally, with no prompt at all, because WebView has no way for the host app to grant new permission types.
- That changes with Android 17.
ACCESS_LOCAL_NETWORKbecomes a mandatory runtime permission for apps targeting API 37+, and WebView traffic inherits the permission state of the host app. So on Android 17 the in-app browser can only reach your laptop if KakaoTalk (or whichever app it is) holds that permission — and those apps have little reason to ask for it. Treat--lan-tlsas something that works well today and may stop working, not as a foundation. iOS has been like this since 14: the local-network check applies toWKWebView, and the host app must declareNSLocalNetworkUsageDescription. - Offline capture is the path that can't be taken away.
agent.copyCapture()needs no network, no certificate and no permission, which is why it stays the fallback for a locked-down build. - Some networks won't resolve it. Corporate resolvers and many routers drop public DNS answers that point at private addresses (rebinding protection). crosspane checks at startup and tells you so rather than failing silently.
- The certificate's private key is public — that's how
*.local-ip.shworks, and it's the only way to get a trusted certificate for an address that isn't yours. So this buys trust, not secrecy: someone on your Wi-Fi could decrypt the traffic. It replaces plain HTTP, which they could read anyway, and reading sessions still needs the?t=token. Don't use it on a network where that matters — use your own certificate or a tunnel. - It depends on
local-ip.shstaying up, both for DNS and for the certificate (fetched once and cached until a week before expiry).
A self-signed certificate does not work in app webviews either: since Android 7, apps don't
trust user-installed CAs. That's why crosspane accepts a certificate but never generates one — and
why --tls-cert is for a hub the page can actually reach (an internal network, or a public one).
Anyone who knows your hub's address can send junk sessions to it — never read one. If that matters
for a hub that's long-lived and shared, --ingest-key <key> requires a ?k= from senders too, at
the cost of carrying it in your env var.
- Console —
console.*with argument serialization, uncaught errors with stacks, unhandled promise rejections. Filter by level, search, follow-tail - Network — every request the page makes, not just the ones we can intercept. fetch and
XHR are hooked (status, duration, failures, optional body previews); images, CSS, scripts,
sendBeacon,EventSourceand requests that fired before the agent loaded are recovered from resource timing. Requests hidden by a filter are always counted on screen, so an empty list never means "we didn't record it" - Timeline — logs, requests, clicks and performance in one stream, filterable by kind.
devtools splits these across tabs, so you rebuild the causality in your head; here you read
click button#pay→POST 500 /api/pay→payment failedin three consecutive lines - User interactions — clicks, form submits, control keys and typing length. What you typed is never captured, so a password can't leak into a log
- Rendering and responsiveness — LCP, CLS, INP, FCP, TTFB and long tasks, so "why is this slow" is answerable in a webview that has no devtools
- Navigation timeline — SPA route changes included, so logs are grouped by screen
- Session list — several devices at once, each labeled, live/ended state, error badges
- Save and replay — save what you're watching live to a
.crosspane.json, or drop a file someone sent you back into the dashboard; identical UI either way - Screen recording (opt-in) — add
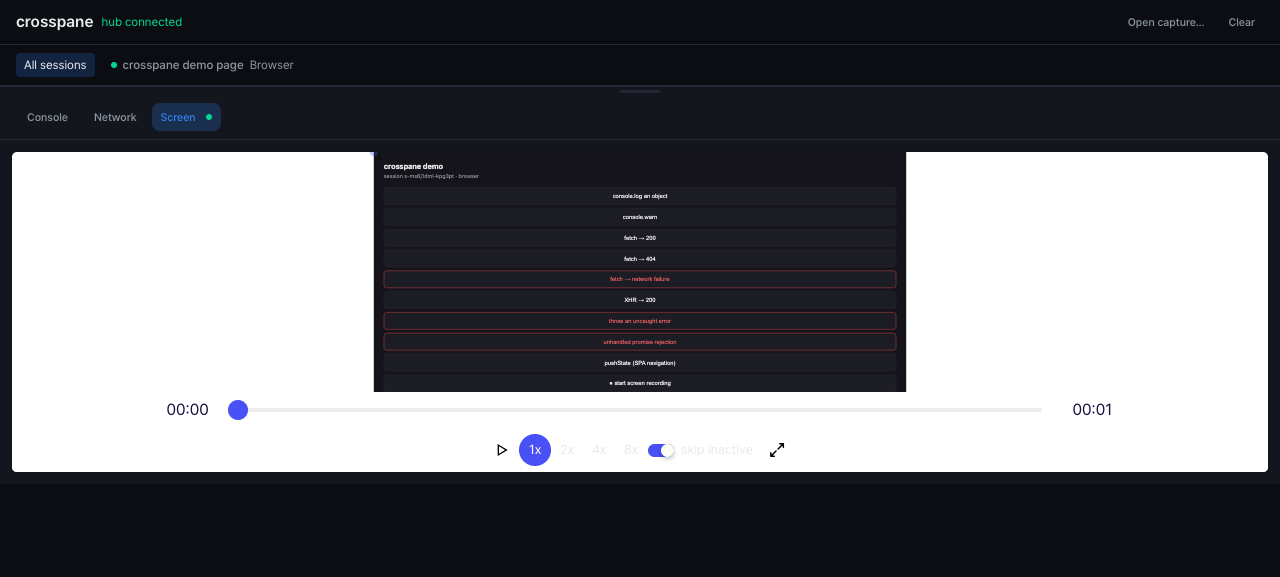
@crosspane/agent-replayto record the DOM and play it back in the Screen tab, in the same timeline as the logs - MCP server —
crosspane mcplets a coding agent read the sessions itself, so you can ask "why did the payment webview fail?" instead of copying logs out of the dashboard - English and Korean — the dashboard follows your browser's language and switches in the header; the choice sticks
Use it when you can — chrome://inspect and Safari Web Inspector are better tools.
crosspane exists for when they don't work:
| Situation | Remote inspector | crosspane |
|---|---|---|
Release build without setWebContentsDebuggingEnabled / isInspectable |
✗ nothing appears | ✓ |
| App protection (ISMS-P style) that kills the app on debugger attach | ✗ | ✓ |
| Tester on another desk / another city with no Mac | ✗ | ✓ export a file |
| In-app browser inside someone else's app | ✗ | ✓ (if you control the page) |
| Kiosk, TV, embedded display | ✗ | ✓ |
| Breakpoints, DOM inspection, profiling | ✓ | ✗ — use the real inspector |
crosspane collects console output and request metadata. Treat it as a debug build feature:
// Keep it on, gated — this is what lets you debug the bug that only happens in production
initCrosspane({ serverUrl: HUB, enabled: isDebugActivated })

// Or drop it from store builds entirely, if you never want it shipped
if (process.env.NODE_ENV !== 'production') {
  const { initCrosspane } = await import('@crosspane/agent')
  initCrosspane({ label: 'checkout webview' })
}
enabled: falseinstalls no hooks at all —console/fetch/XHR stay untouched, so a visitor who hasn't opted in is unaffected- The address in your build is just an address: sending sessions needs no credential, and reading them needs a token that stays on your machine. That's why it's safe in a page whose source anyone can read — see SECURITY.md
- Response bodies are not captured unless you pass
captureBodies: true - The agent has no dependencies and adds ~5 KB gzipped
crosspane [options]

--port <n>     dashboard port (default: 7788; the default port falls back +1 when taken,
               an explicit port does not)
--host <addr>  bind address (default: 127.0.0.1 — local only. Use 0.0.0.0 to receive
               live agent sessions from phones/devices on your network)
--lan-tls      serve the hub over https/wss on your LAN with a certificate devices
               already trust, so a deployed https:// page can reach it from the same
               Wi-Fi. Implies --host 0.0.0.0
--tunnel       start a tunnel with an installed cloudflared or ngrok and advertise its
               address. Session logs transit that provider; nothing is downloaded for you
--hostname <name>
               a permanent address instead of a throwaway one — with --tunnel, crosspane
               creates and routes a named Cloudflare tunnel (idempotent)
--tls-cert <file> / --tls-key <file>
               serve over https/wss with your own certificate
--public-url <url>
               advertise this address instead of the LAN one, for a tunnel or a reverse
               proxy in front of the hub. Given once, remembered
--write-env [file]
               write this hub's address into an env file (default .env.local) so the
               agent needs no arguments; removed again when the hub stops
--ingest-key <key>
               require senders to include ?k=<key> too. Off by default, so the address
               is all your app needs
--no-auth      disable the read token that exposing the hub adds — only on a network you
               fully trust
--no-open      don't open the dashboard automatically
--verbose      diagnostic logging — attach to bug reports
-v, --version  print the version
-h, --help     show help
Exposing the hub generates two credentials, and the difference matters: a write-only ingest
key (?k=) is safe in a deployed page whose source anyone can read, while the read token
(?t=) belongs only in your dashboard URL. crosspane never puts the read token in an address
meant for your app.
While the hub runs it prints each session as it joins and leaves, with the page's URL — so you can tell "my app can't reach the hub" from "my app isn't running that code" without opening anything.
crosspane mcp exposes the running hub's sessions over the Model Context Protocol, so a
coding agent can read the console and network itself. Register it once:
{ "mcpServers": { "crosspane": { "command": "crosspane", "args": ["mcp"] } } }Then, with the hub running and a device attached, ask in plain language — "the checkout
webview on the test phone is stuck on the spinner, what's failing?" The agent calls
list_sessions, then get_errors, and reads the stack and the failed request itself.
| Tool | Returns |
|---|---|
list_sessions |
attached sessions with labels, platform and event counts |
get_errors |
exceptions, console errors and failed requests, in order |
get_console |
console output, filterable by level and text |
get_network |
requests with status and duration, failedOnly to narrow |
get_timeline |
everything chronologically, to see the lead-up to a failure |
Sessions can be named by id, by label, or by part of a label; omit it entirely when only one
device is attached. Pass --hub <url> if the hub isn't on the default port.
const agent = initCrosspane({
  label?: string            // shown in the dashboard (default: document.title)
  enabled?: boolean | (() => boolean)
  serverUrl?: string        // usually omit — resolved automatically (see below)
  bufferSize?: number       // ring buffer size (default: 2000 events)
  captureBodies?: boolean   // capture response bodies (default: false)
  bodyPreviewLimit?: number // default: 2048 chars
})

agent.live           // → true if a hub address was resolved (NOT that the hub answered)
agent.capture()      // → SessionCapture object (send it wherever you like)
agent.exportFile()   // → downloads .crosspane.json
agent.copyCapture()  // → Promise<boolean>, puts the JSON on the clipboard
agent.dispose()      // → restores console/fetch/XHR, closes the live connection
serverUrl is resolved in this order, so you rarely pass it:
| Page is on | Live mode connects to |
|---|---|
localhost |
http://localhost:7788 automatically, or the injected address if there is one |
| any other host | the injected address — only on devices activated with ?__crosspane=on |
| anywhere, no injected address | nothing; the ring buffer still records for offline capture |
Passing serverUrl yourself always wins and never needs activation — writing it down is
already a deliberate act. Injected addresses are treated more carefully because CI puts
them there, so they can end up in a production build.
Offline capture is the main path on a security-locked build, so the capture has to be able
to leave the device. Do not assume the download works — exportFile() creates a blob
and clicks a link, which a webview only honours if the host app implements downloads
(setDownloadListener on Android, WKDownloadDelegate on iOS); in-app browsers usually
block it outright, and there is no way to detect the failure from JavaScript.
Worse, the modern escape hatches are unavailable exactly where you need them. An in-house
build served from http://<lan-ip> is not a secure context, so navigator.clipboard
and navigator.share are not merely restricted — they are undefined (measured, not
assumed). Pick a route that survives that:
| Route | Works without app changes | Notes |
|---|---|---|
agent.copyCapture() |
✓ | Falls back to execCommand('copy') on non-secure origins. Needs a user gesture — call it from a tap, not on a timer. Returns false if it couldn't copy: show that to the tester, or they'll blame the tool instead of reporting the bug |
| Native bridge | ✗ (a few lines of app code) | The most reliable route for RN / native webviews — see below |
agent.exportFile() |
✗ | Fine in a desktop browser or a webview whose host implements downloads |
| Live mode | ✓ | Best when the device can reach your machine; the hub also saves sessions itself. From an https:// page the hub needs wss:// — see Debugging an https:// page |
For a native webview, hand the object to the app and let it write a file or open a share sheet — it is a plain JSON-serializable value:
// React Native WebView
window.ReactNativeWebView?.postMessage(JSON.stringify(agent.capture()))

// iOS WKWebView (app registers a "crosspane" script message handler)
window.webkit?.messageHandlers?.crosspane?.postMessage(agent.capture())

// Android (app calls addJavascriptInterface(obj, "CrosspaneNative"))
window.CrosspaneNative?.save(JSON.stringify(agent.capture()))The agent is plain DOM JavaScript — it runs in any modern webview or browser: Android WebView, WKWebView, React Native WebView, Flutter InAppWebView, in-app browsers, Electron, kiosk browsers. The hub runs on macOS, Windows and Linux (Node ≥ 20).
- Screen recording via rrweb — @crosspane/agent-replay
- MCP server —
crosspane mcp, so coding agents query session logs directly - Attach mode: Android WebView over CDP (
adb) for full DevTools on debug builds - iOS WebKit Inspector attach via pymobiledevice3
- Framework adapters (React Native bridge, Flutter)
pnpm install
pnpm build
pnpm try       # hub on :7788 + demo page on :7999 — open the demo page and click things
pnpm test # unit + integration
pnpm coverage # same, with the coverage ratchet enforced
pnpm typecheck # sources and tests
pnpm smoke # end-to-end: real hub process + agent round-trip (no browsers needed)See ARCHITECTURE.md for the design, docs/decisions.md for why things are shaped the way they are, and CONTRIBUTING.md to get started.
Try it in 30 seconds with the demo page.