
Hossam Fawzy Elsafty October 4th, 2018
Cats and dogs is the most common animal in human houses . Humans love to have cats and dogs to live , play and take a picture with them . after taking hundreds of photos you may want to category it to cats and dogs photos.
instead to make it manually we will write an algorithm to classify whether images contain either a dog or a cat. This is easy for humans to classify it but Your computer will find it a bit more difficult.
This is a Classification problem that has a lot of label data as training data and desired output and we required from this data to get new picture and classify if the picture contain cat or dog .
we can divide the projects into parts as following :
- load the dataset.
- preprocessing the data such as : (Rescale , Resize , divide the data into validation and training).
- build the classifer using keras and TensorFlow .
- training the data using classifer.
- compare between the models and get the best classifer model.
- use the classifer to classify new data.
the most important metrics to measure the performance of the classification is Accuracy and Log loss . ####Accuracy Accuracy in classification problems is the number of correct predictions made by the model over all kinds predictions made. resources
#####Terms associated with Confusion matrix:
-
True Positives (TP): True positives are the cases when the actual class of the data point was (True) and the predicted is also (True) Ex: The case where a person is actually having cancer(1) and the model classifying his case as cancer(1) comes under True positive.
-
True Negatives (TN): True negatives are the cases when the actual class of the data point was 0(False) and the predicted is also 0(False)
Ex: The case where a person NOT having cancer and the model classifying his case as Not cancer comes under True Negatives. -
False Positives (FP): False positives are the cases when the actual class of the data point was 0(False) and the predicted is 1(True). False is because the model has predicted incorrectly and positive because the class predicted was a positive one. (1)
Ex: A person NOT having cancer and the model classifying his case as cancer comes under False Positives. -
False Negatives (FN): False negatives are the cases when the actual class of the data point was 1(True) and the predicted is 0(False). False is because the model has predicted incorrectly and negative because the class predicted was a negative one. (0)
Ex: A person having cancer and the model classifying his case as No-cancer comes under False Negatives.
####Log Loss Logarithmic loss (related to cross-entropy) measures the performance of a classification model where the prediction input is a probability value between 0 and 1. The goal of our machine learning models is to minimize this value. A perfect model would have a log loss of 0. Log loss increases as the predicted probability diverges from the actual label. So predicting a probability of .012 when the actual observation label is 1 would be bad and result in a high log loss.
- Accuracy is the count of predictions where your predicted value equals the actual value. Accuracy is not always a good indicator because of its yes or no nature.
- Log Loss takes into account the uncertainty of your prediction based on how much it varies from the actual label. This gives us a more nuanced view into the performance of our model.
Equation :

- n is the number of images in the test set
- y i is the predicted probability of the image being a dog
- yi is 1 if the image is a dog, 0 if cat
- log() is the natural (base e) logarithm A smaller log loss is better.
\pagebreak
(approx. 2-4 pages)
our dataset that downloaded from kaggle contain 2 folders (train and test). the training folder contain 25000 image of cats and dog , 12500 for cats and 12500n for dogs , each image label by name of the picture in the following format : cat.n.jpg , where n is number , so we can know if the picture is cat or dog from image name .
in test folder the picture hasn't label, it named as numbers.
the dataset image is real world picture the has different size that take from different device.
some image in dataset is hard to detect if it is cat or dog such as images contain dog and cat in the same picture , some image is drawing or not real data such as following data from dataset:


#####images from Dataset before preprocessing and after preprocessing:

i use 2 techniques to solve this problem first technique is using keras from skratch and second one is ResNet50 .
Deep Learning :
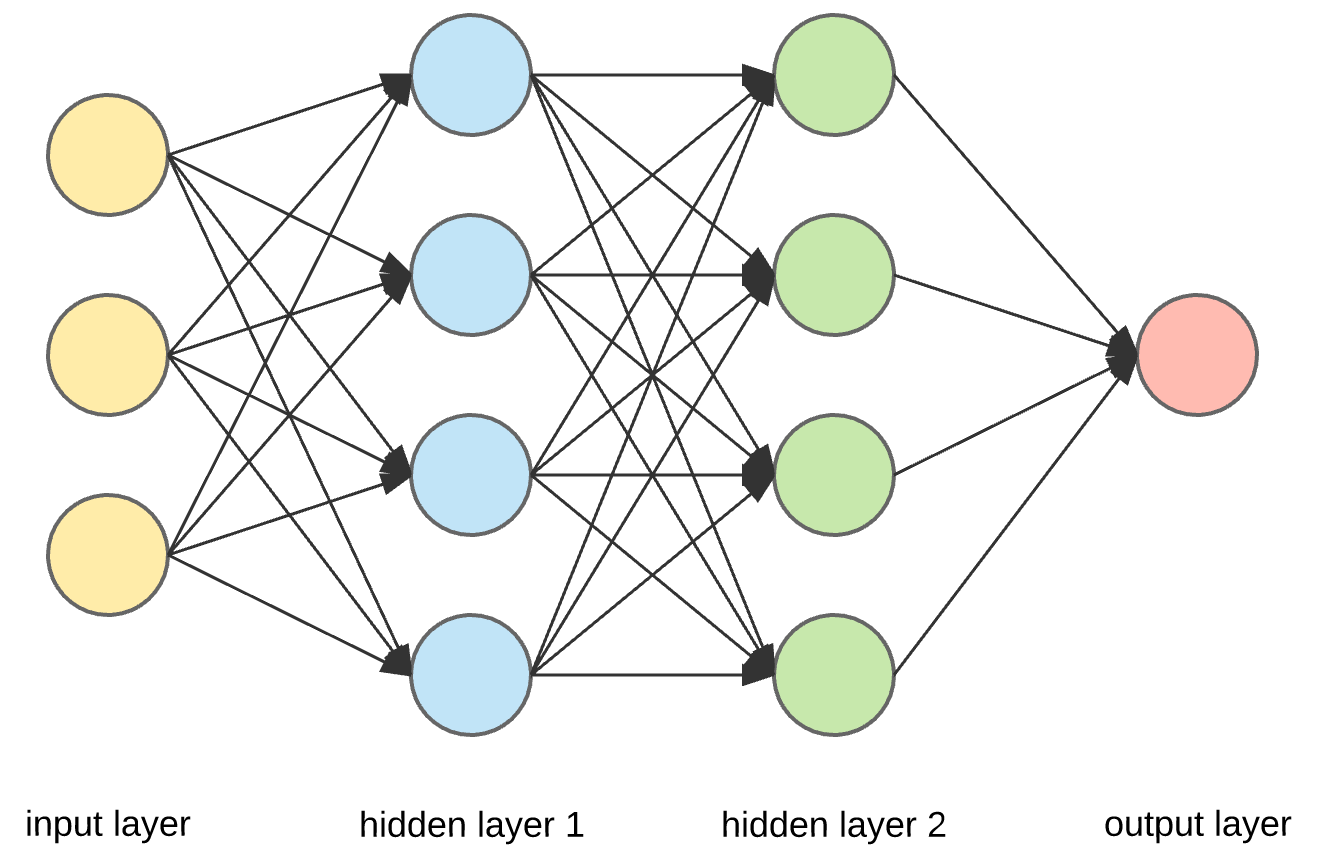
Neural networks consist of individual units called neurons. Neurons are located in a series of groups?ó?layers (see figure allow). Neurons in each layer are connected to neurons of the next layer. Data comes from the input layer to the output layer along these compounds. Each individual node performs a simple mathematical calculation. ?hen it transmits its data to all the nodes it is connected to.
CNN : Let us consider the use of CNN for image classification in more detail. The main task of image classification is acceptance of the input image and the following definition of its class. This is a skill that people learn from their birth and are able to easily determine that the image in the picture is an elephant. But the computer sees the pictures quite differently:

To solve this problem the computer looks for the characteristics of the base level. In human understanding such characteristics are for example the trunk or large ears. For the computer, these characteristics are boundaries or curvatures. And then through the groups of convolutional layers the computer constructs more abstract concepts.
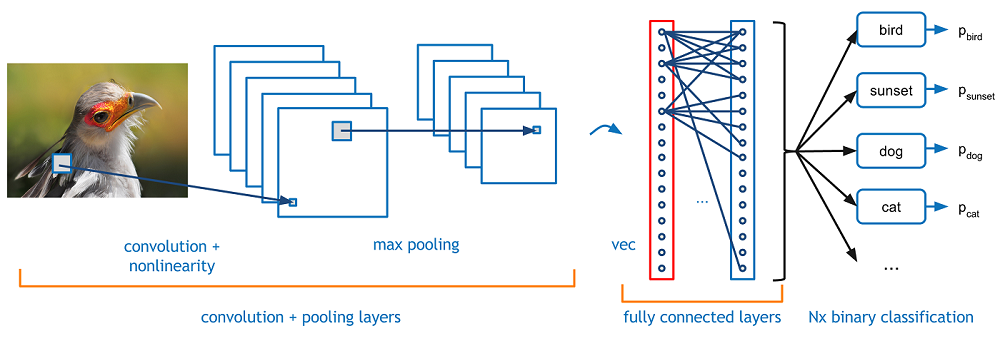
In more detail: the image is passed through a series of convolutional, nonlinear, pooling layers and fully connected layers, and then generates the output.
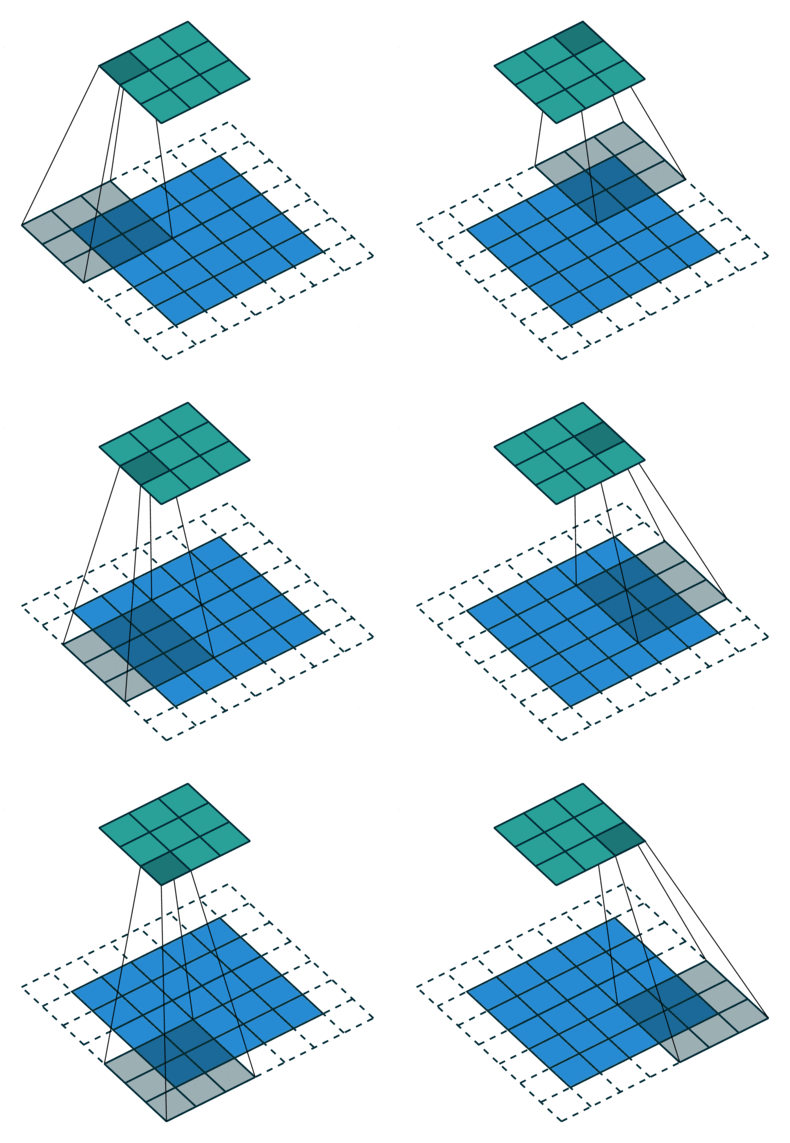
The Convolution layer is always the first. ?he image (matrix with pixel values) is entered into it. Imagine that the reading of the input matrix begins at the top left of image. Next the software selects a smaller matrix there, which is called a filter (or neuron, or core). Then the filter produces convolution, i.e. moves along the input image. The filterís task is to multiply its values by the original pixel values. All these multiplications are summed up. One number is obtained in the end. Since the filter has read the image only in the upper left corner, it moves further and further right by 1 unit performing a similar operation. After passing the filter across all positions, a matrix is obtained, but smaller then a input matrix.
our model is build as following :
Layer (type) Output Shape Param
conv2d_7 (Conv2D) (None, 222, 222, 32) 896
activation_11 (Activation) (None, 222, 222, 32) 0
max_pooling2d_7 (MaxPooling2 (None, 111, 111, 32) 0
conv2d_8 (Conv2D) (None, 109, 109, 32) 9248
activation_12 (Activation) (None, 109, 109, 32) 0
max_pooling2d_8 (MaxPooling2 (None, 54, 54, 32) 0
conv2d_9 (Conv2D) (None, 52, 52, 64) 18496
activation_13 (Activation) (None, 52, 52, 64) 0
max_pooling2d_9 (MaxPooling2 (None, 26, 26, 64) 0
flatten_3 (Flatten) (None, 43264) 0
dense_5 (Dense) (None, 64) 2768960
activation_14 (Activation) (None, 64) 0
dropout_3 (Dropout) (None, 64) 0
dense_6 (Dense) (None, 1) 65
activation_15 (Activation) (None, 1) 0
Total params: 2,797,665 Trainable params: 2,797,665 Non-trainable params: 0
Let us look at the first convolution layer Conv 2D. The number 32 shows the amount of output filter in the convolution. Numbers 3, 3 correspond to the kernel size, which determinate the width and height of the 2D convolution window. An important component of the first convolution layer is an input shape, which is the input array of pixels. Further convolution layers are constructed in the same way, but do not include the input shape and the image size is 224. The activation function of this model is Relu. This function setts the zero threshold and looks like: f(x) = max(0,x). If x > 0?ó?the volume of the array of pixels remains the same, and if x < 0?ó?it cuts off unnecessary details in the channel. Max Pooling 2D layer is pooling operation for spatial data. Numbers 2, 2 denote the pool size, which halves the input in both spatial dimension. After three groups of layers there are two fully connected layers. Flatten performs the input role. Next is Dense?ó?densely connected layer with the value of the output space (64) and Relu activation function. It follows Dropout, which is preventing overfitting. Overfitting is the phenomenon when the constructed model recognizes the examples from the training sample, but works relatively poorly on the examples of the test sample. Dropout takes value between 0 and 1. ?he last fully connected layer has 1 output and Sigmoid activation function.
we use pretrain model ResNet50 which is very powerful in classification problem .
ResNet is better than keras because deeper neural networks are more difficult to train. We present a residual learning framework to ease the training of networks that are substantially deeper than those used previously. We explicitly reformulate the layers as learning residual functions with reference to the layer inputs, instead of learning unreferenced functions. We provide comprehensive empirical evidence showing that these residual networks are easier to optimize, and can gain accuracy from considerably increased depth. On the ImageNet dataset we evaluate residual nets with a depth of up to 152 layers---8x deeper than VGG nets but still having lower complexity.
Pre-trained models are beneficial to us for many reasons. By using a pre-trained model you are saving time. Someone else has already spent the time and compute resources to learn a lot of features and your model will likely benefit from it.
ResNet Archticture :


our model :
Layer (type) Output Shape Param
resnet50 (Model) (None, 2048) 23587712
dense (Dense) (None, 2) 4098
Total params: 23,591,810 Trainable params: 4,098 Non-trainable params: 23,587,712
in the kaggle competition in the loadboard the best time that make high score is :Pierre Sermanet score is :0.98533 the score in the competition is the percentage of correct prediction in the testing set. resources
(approx. 3-5 pages)
- load the all data from training folder.
- split it into validation data and training data .
- divide the data into train (cat , dog) and validation (cat , dog).
- resize all picture to fixed size (224x224)
- rescale all color in images from 0
255 to 01
the main steps in my implementation :
- build 3 layers of CNN each layer contain Activation Relu and max poll.
- use flatten to convert our 3D feature to 1D vercor .
- make dropout layer to decrease the overfitting.
- make the last layer dense with size 1 because our output is one number 0 or 1.
- after building the model we fit our dataset on the keras model and get graph of log loss and accuracy.
- build ResNet 50 model .
- first layer will be ResNet 50 .
- second layer is dense layer to get the output and activation softmax.
- trun off training first because it is already trained.
- use optimizers to make it more efficient.
- finally compile our model and fit it with our dataset .
- get the log loss and Accurate and compare it with keras and use the best model to predict the image if it is cat or dog.
there is many area that refine our model , first thing we should choose the suitable number to resize our picture because the is many images that contain picture of cat or dog but the cat take very small area in the picture so if you choose small number of resize the image you will get accuracy under 80% so i choose 224x224 and i it give me good accuracy ~95%.
using optimzer will refine our model and increase the accuarcy , we use Sgd optimzer on ResNet 50 .
finally after make 2 model (using keras , ResNet50) the following picture is the accuracy and log loss of the two model.
using keras :

and this seem very good score , let as show ResNet50 model and compare it with this model .
using ResNet50 :

loss: 0.0988 - acc: 0.9670 - val_loss: 0.0762 - val_acc: 0.9730
ResNet Strengthen our model , the accuracy increase from 81 to 96 which is very large score and log loss from .42 which is big to .09 and this very perfect .
in respect to validation score also it become very good score our accuracy become 97% which is very acceptable score and the log loss change from .38 in keras to .07 in ResNet .
not only the accuracy and log loss which become very strong but the time to reach the score become very small, as we show in graph the inceasing of keras is very slow and each epoch take 10min so it take very large time to trained.
but in ResNet , it reach high score from first epcho and the training time is very small because it trained before .
(approx. 2-3 pages)
as mention above , we reach to accuracy high 90% and it is near to our benchmark , and the log loss is very small which is very good .
best model is ResNet50 and we didn't change on the orignal structure of the ResNet50, we only add dense layer to get output then use optimzer SGD.
it gives to us very high score and we test it on 10 random real world images and it gives us good score .
the epcho time is very small it takes 1 min , but we note that after 10 epcho we get good number and the accuracy increase very slow , so the best epcho is 10 .
The plot of Acurracy and log loss shows the best validation accuracy of ResNet 50 for Cats.Vs.Dogs is 96.70% which is less than the best score in kaggle which is 0.98533 but it is acceptable accuracy.
we test our model in 10 random images in the test folder predicted by the classifier , as we show all images predicted successfully except 2 images but i think it is acceptable error .
(approx. 1-2 pages)
we try on clear picture and we get 100% correct i think the resolution of the image and the face and body of animal display clearly in the image that helped as to correct classify.


in second miss prediction i think because it is only face of cat and small picture so i think after resize it may become very difficult to classify.
the first challenge to me to preprocessing the data , first i try to save all data in array of data and label but i find to get the data from folder is much easier and we can use image generatot insead make resize and rescale mannully.
then i tried to make many model but the big problem for me to train model on my device it take a lot of time so i use kernal in kaggle , it is powerful tool and i make my model and reach to my accuracy which is ~82% .
so i tried ResNet , i read about this trained model and it gives me high score 96% .
This problem is very interesting and i have learn a lot of things in CNN , i will make a lot project using this technology.
- we can improve our model by provide extra dataset for cat and dog from all side and all angle
- we can get higher accuracy by improve ResNet structure
- we should make tunning on CNN to be save from overfitting.
- https://www.kaggle.com/c/dogs-vs-cats/
- http://www.datamind.cz/cz/vam-na-miru/umela-inteligence-a-strojove-uceni-ai-machine-learning
- https://en.wikipedia.org/wiki/Artificial_neural_network
- https://en.wikipedia.org/wiki/Deep_learning
- https://en.wikipedia.org/wiki/Convolutional_neural_network
- https://adeshpande3.github.io/adeshpande3.github.io/A-Beginner%27s-Guide-To-Understanding-Convolutional-Neural-Networks/
- https://www.lynda.com/Google-TensorFlow-tutorials/Building-Deep-Learning-Applications-Keras-2-0/601801-2.html
- https://blog.keras.io/building-powerful-image-classification-models-using-very-little-data.html
- https://keras.io
- https://www.kaggle.com/amarjeet007/visualize-cnn-with-keras