
mycolorsTB is an R package that provides color palettes and helper functions to visualize genomic and epidemiological data from the Mycobacterium tuberculosis complex, integrating with ggplot2 and ggtree.
Documentation · Installation · Usage · Color reference · Report an issue
You can install the stable version of mycolorsTB from CRAN or the development version from GitHub.
This is the easiest way to install the package for most users.
install.packages("mycolorsTB")Note on Dependencies: mycolorsTB requires the ggtree package from Bioconductor. If you don't have it installed, you can add it by running:
if (!requireNamespace("BiocManager", quietly = TRUE)) {
    install.packages("BiocManager")
}
BiocManager::install("ggtree")Install this version if you want the latest features or fixes that have not yet been released to CRAN.
1. Install BiocManager and Dependencies
First, ensure you have BiocManager and the core dependencies ggtree, ggplot2, and ape.
if (!requireNamespace("BiocManager", quietly = TRUE)) {
    install.packages("BiocManager")
}
BiocManager::install("ggtree")
install.packages(c("ggplot2", "ape", "remotes"))
2. Install mycolorsTB
Finally, install the package from GitHub using remotes.
remotes::install_github("PathoGenOmics-Lab/mycolorsTB")You can access the color vectors directly:
library(mycolorsTB)

# Vector with lineage names (A1, L1, etc.)
show(mycolorsTB::mycolors)

# Vector of pure colors, without names
show(mycolorsTB::classicTB)
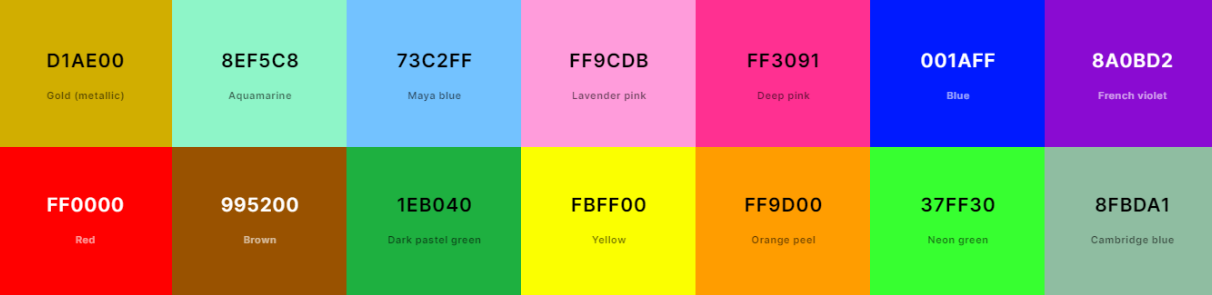
Use scale_fill_mycolors() or scale_color_mycolors() to easily apply the palettes to your plots.
library(ggplot2)

# Example data. The seed is fixed so this snippet uses the same data as the
# figure below, which is rendered by .github/scripts/make_example_plots.R.
set.seed(42)
data <- data.frame(
  x = 1:14,
  y = rnorm(14),
  group = names(mycolorsTB::mycolors)
)

# Bar plot using the default palette
ggplot(data, aes(x = x, y = y, fill = group)) +
  geom_bar(stat = "identity") +
  scale_fill_mycolors() +
  theme_minimal()

https://pathogenomics-lab.github.io/mycolorsTB/ is the manual: what each
palette is for, every export with its signature and defaults, and the failures
that come up when a plot or a tree refuses to draw. The same pages are in
docs/ in this
repository.
| Getting started | Installing in the right order, because ggtree comes from Bioconductor and install.packages() does not know about it |
| Palettes | The three palettes, what the names mean, and which one to reach for |
| Using with ggplot2 | The four scale functions, and when colours are matched by lineage name rather than by position |
| Trees | plot_tb_tree() and plot_tb_cladogram(), and why the tip labels have to be lineage names |
| Reference | All eleven exports, one entry each |
| Troubleshooting | Failures people have actually hit, including the ggtree and ggplot2 pairing that breaks tree tip labels |
Release notes live in NEWS.md and are rendered on the site as the changelog.
- A1:
#d1ae00 - A2:
#8ef5c8 - A3:
#73c2ff - A4:
#ff9cdb - L1:
#ff3091 - L2:
#001aff - L3:
#8a0bd2 - L4:
#ff0000 - L5:
#995200 - L6:
#1eb040 - L7:
#fbff00 - L8:
#ff9d00 - L9:
#37ff30 - L10:
#8fbda1
(L8,((L1,(L7,(L4,(L2,L3)))),(L5,((A2,(A3,A4)),(A1,(L10,(L6,L9)))))));