Take a tour of xyCLI, from launching jobs to investigating server health and managing your automation. Click any screenshot to open the full-size image.
Return to the README or explore the command reference.
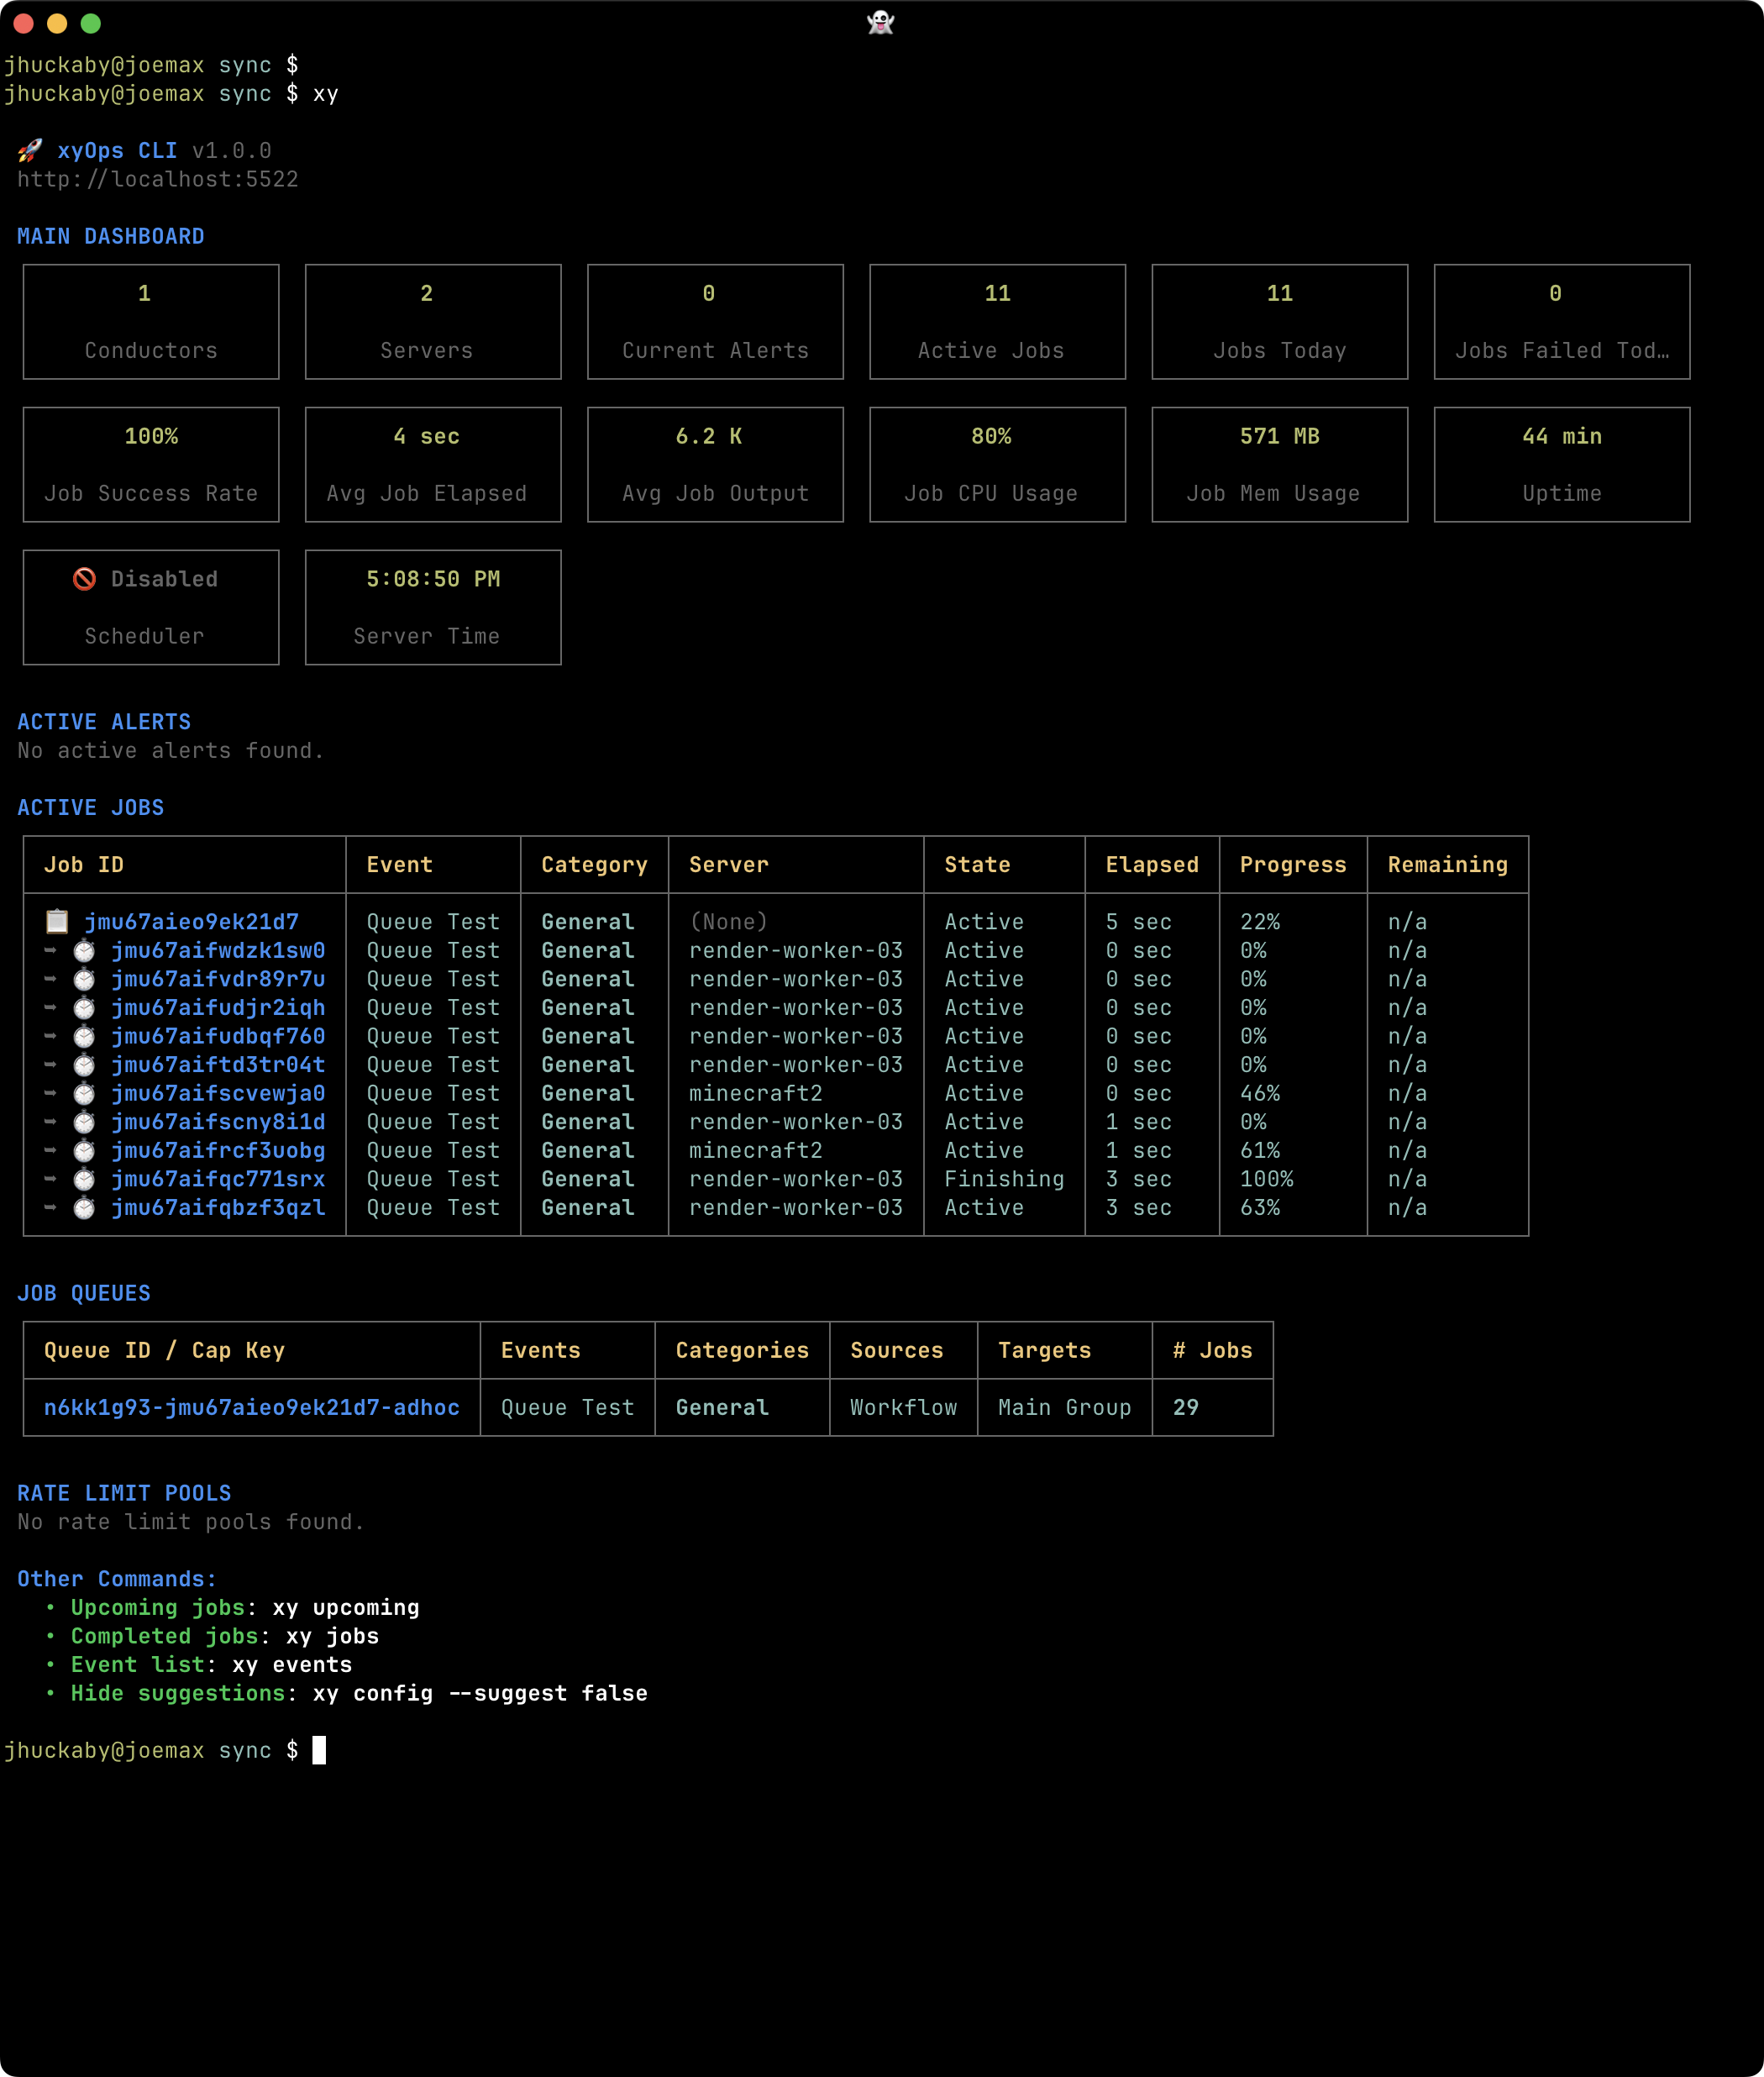
See server health, active Alerts and jobs, queued work, and rate limits at a glance.
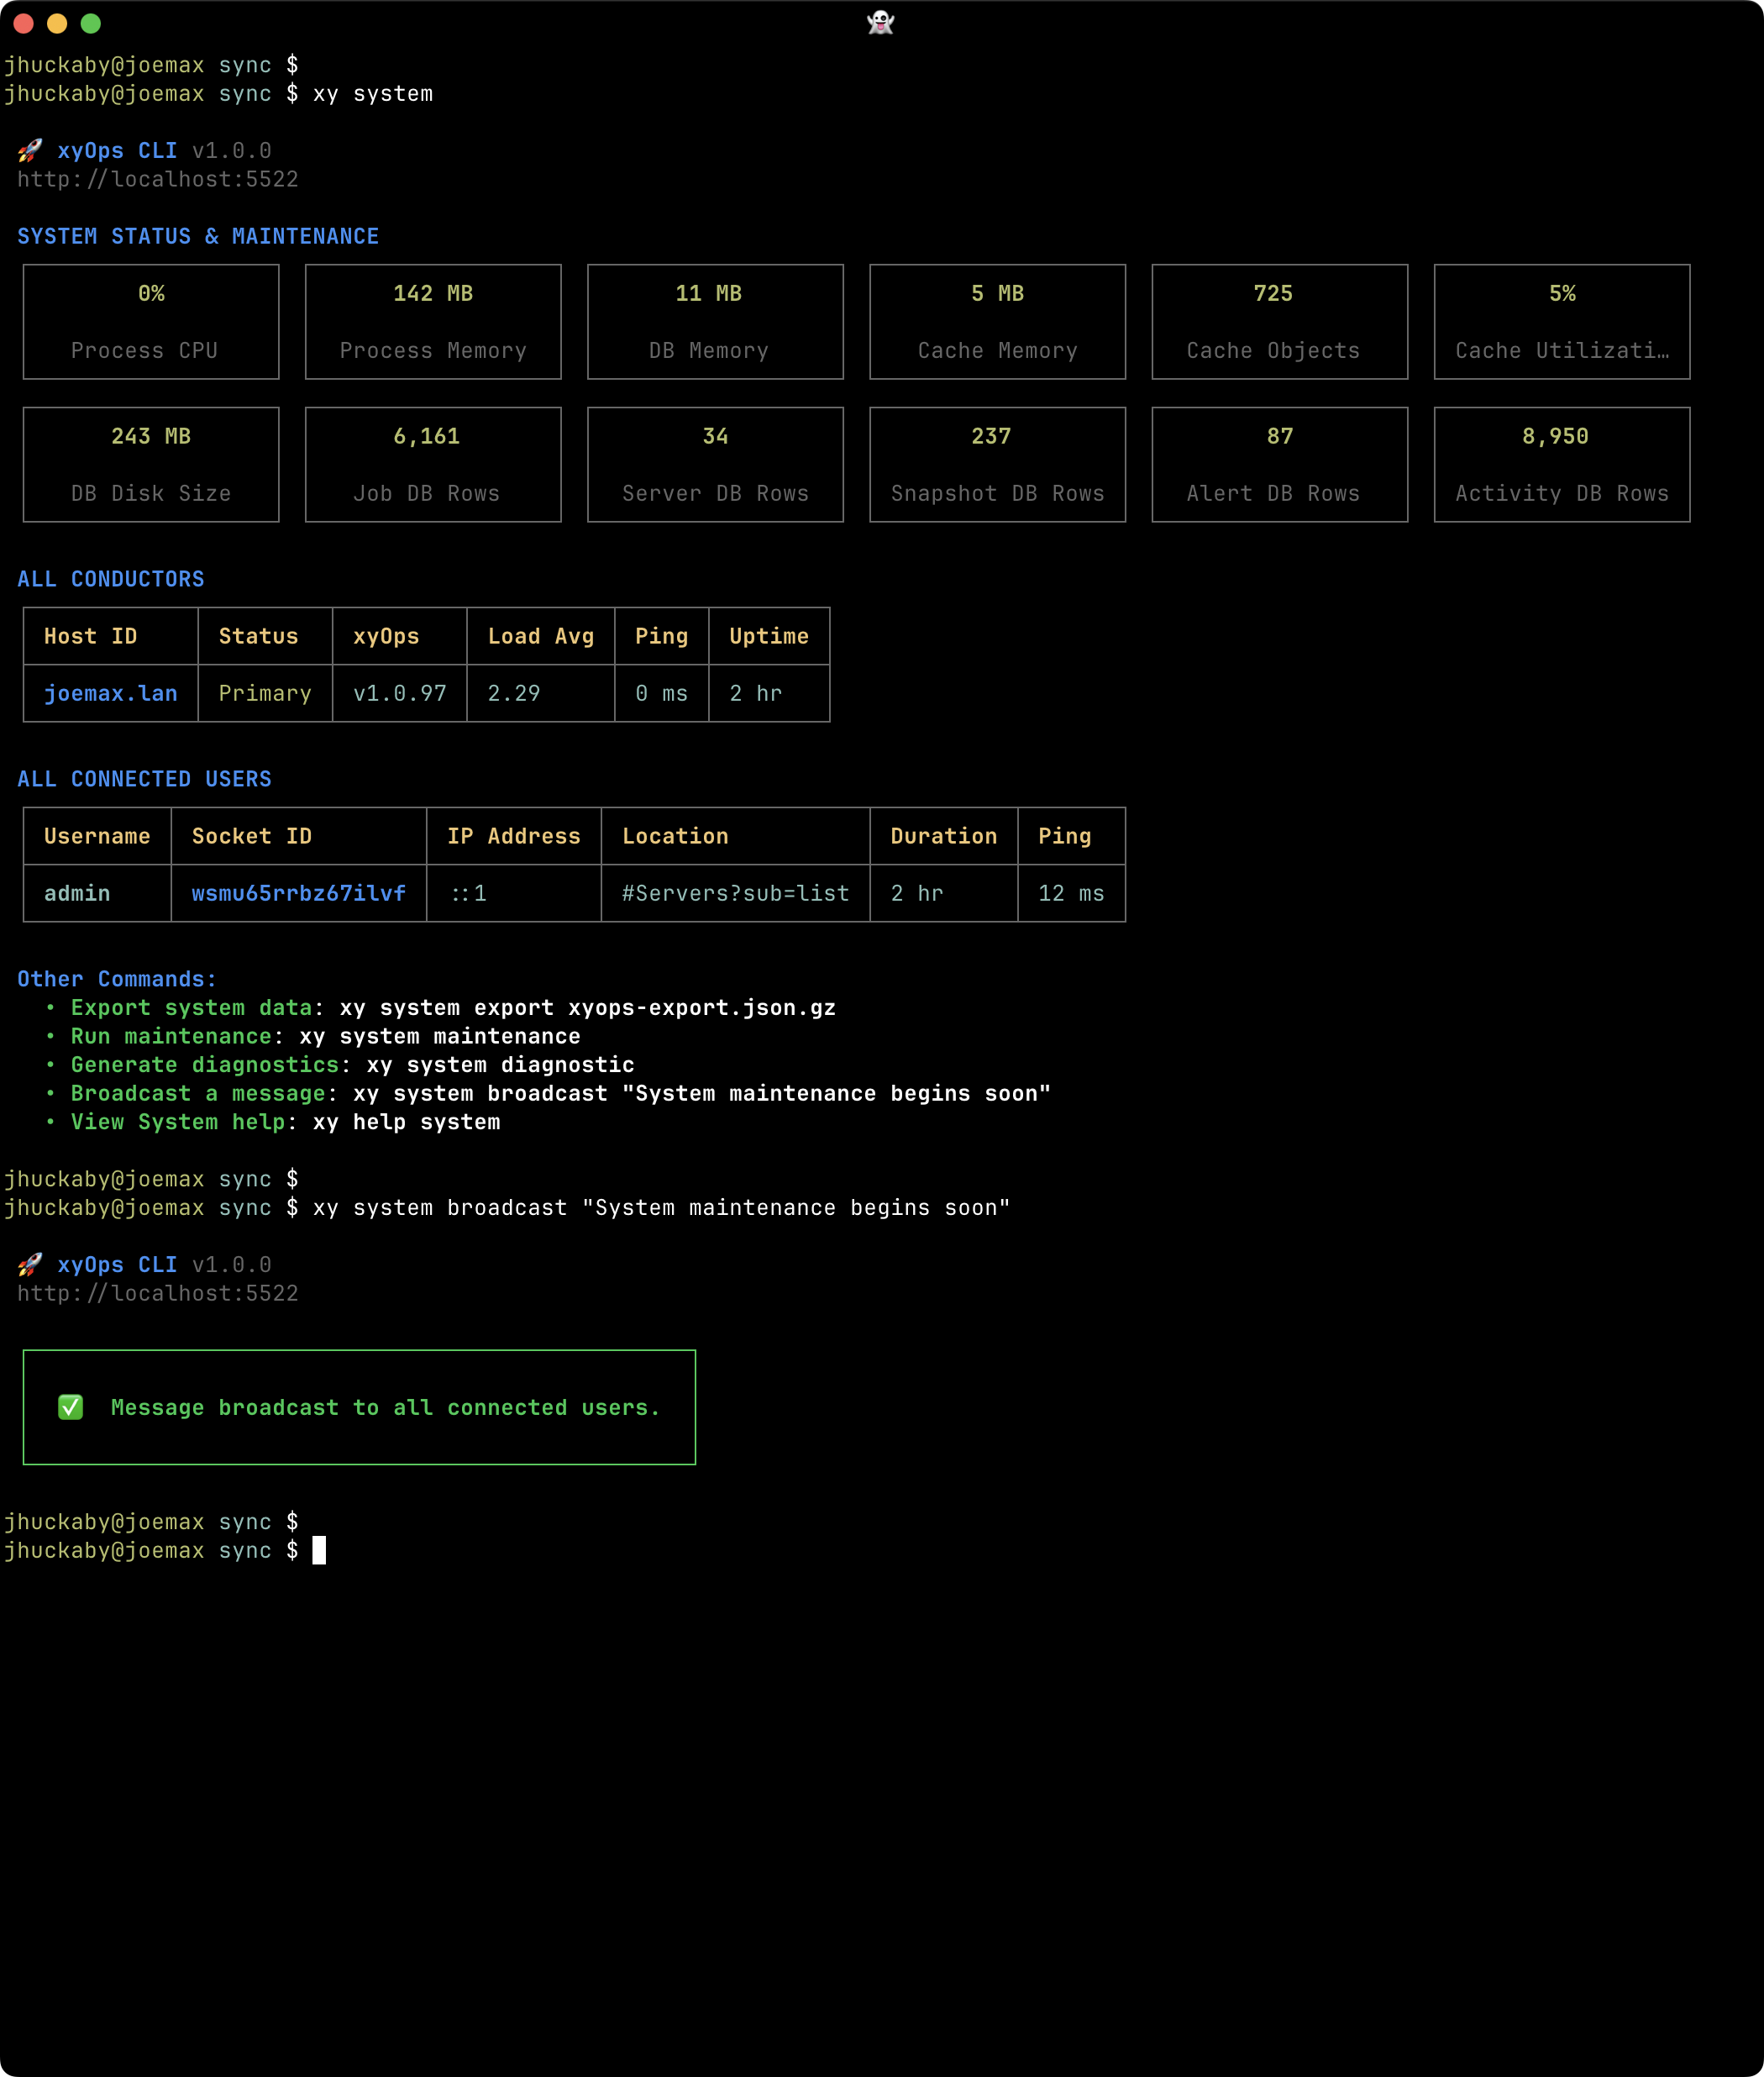
Inspect conductor status, process and database statistics, internal jobs, and connected users.
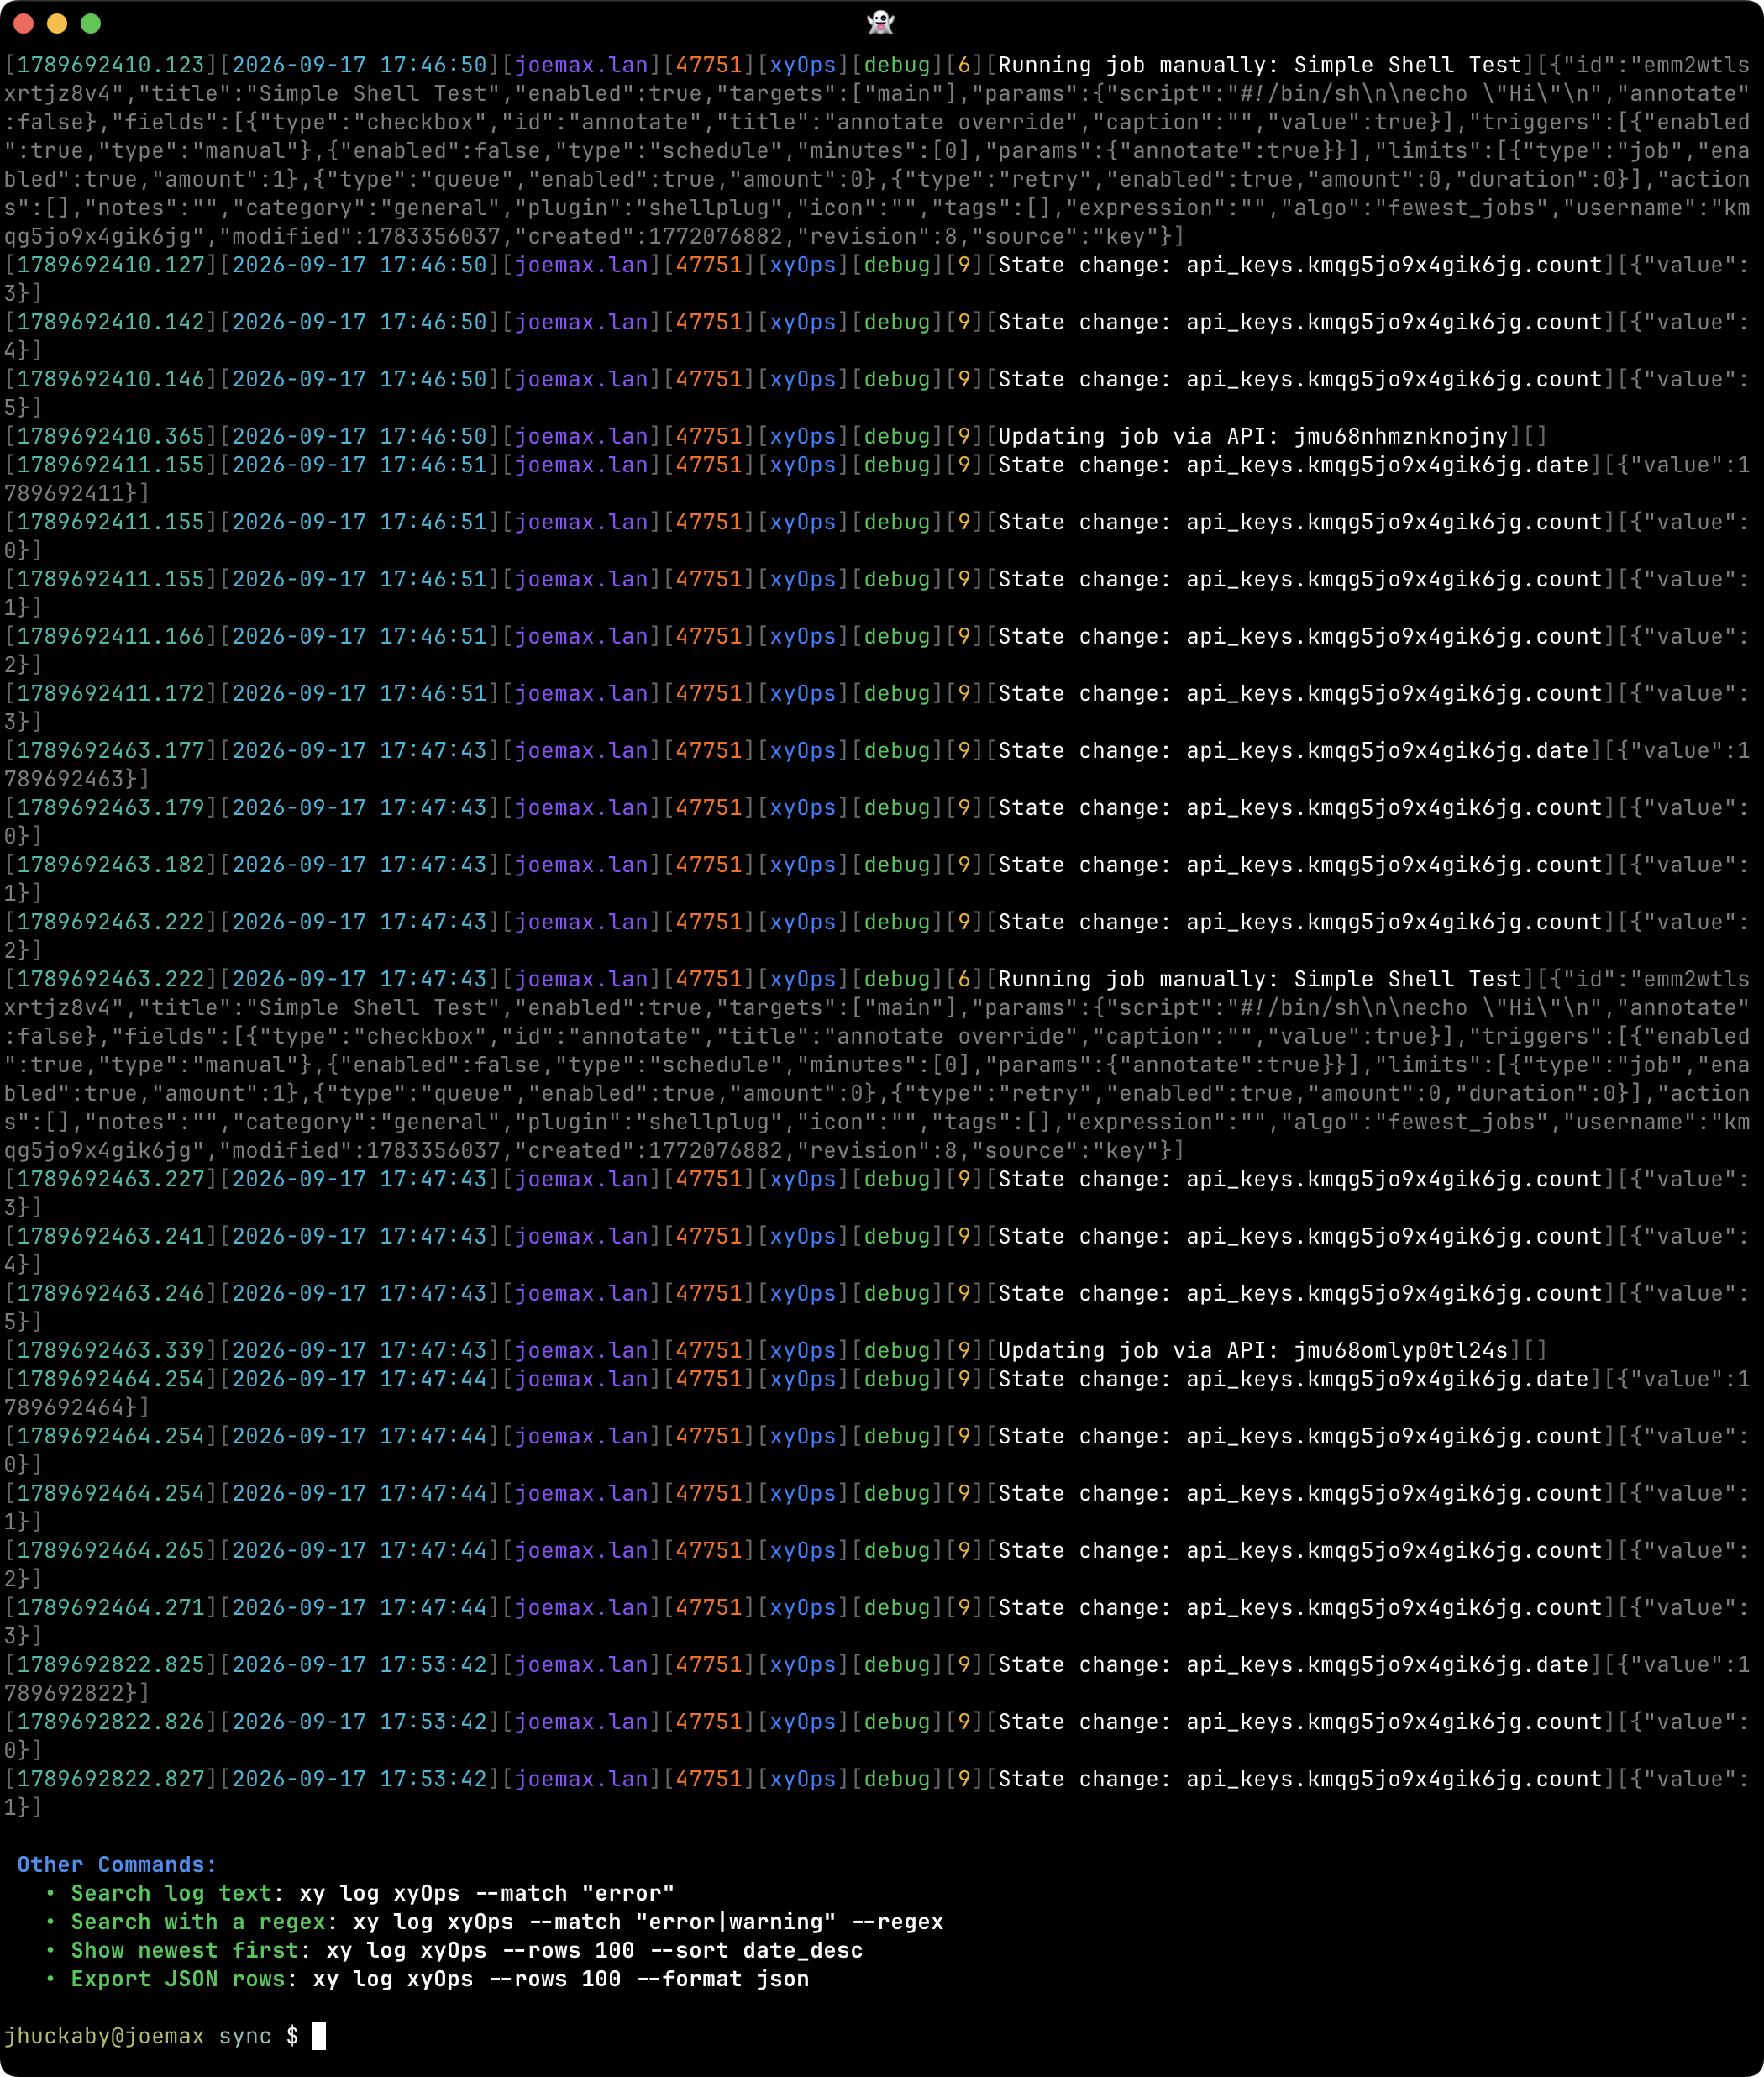
Read color-coded system log rows and search for the details you need while troubleshooting.
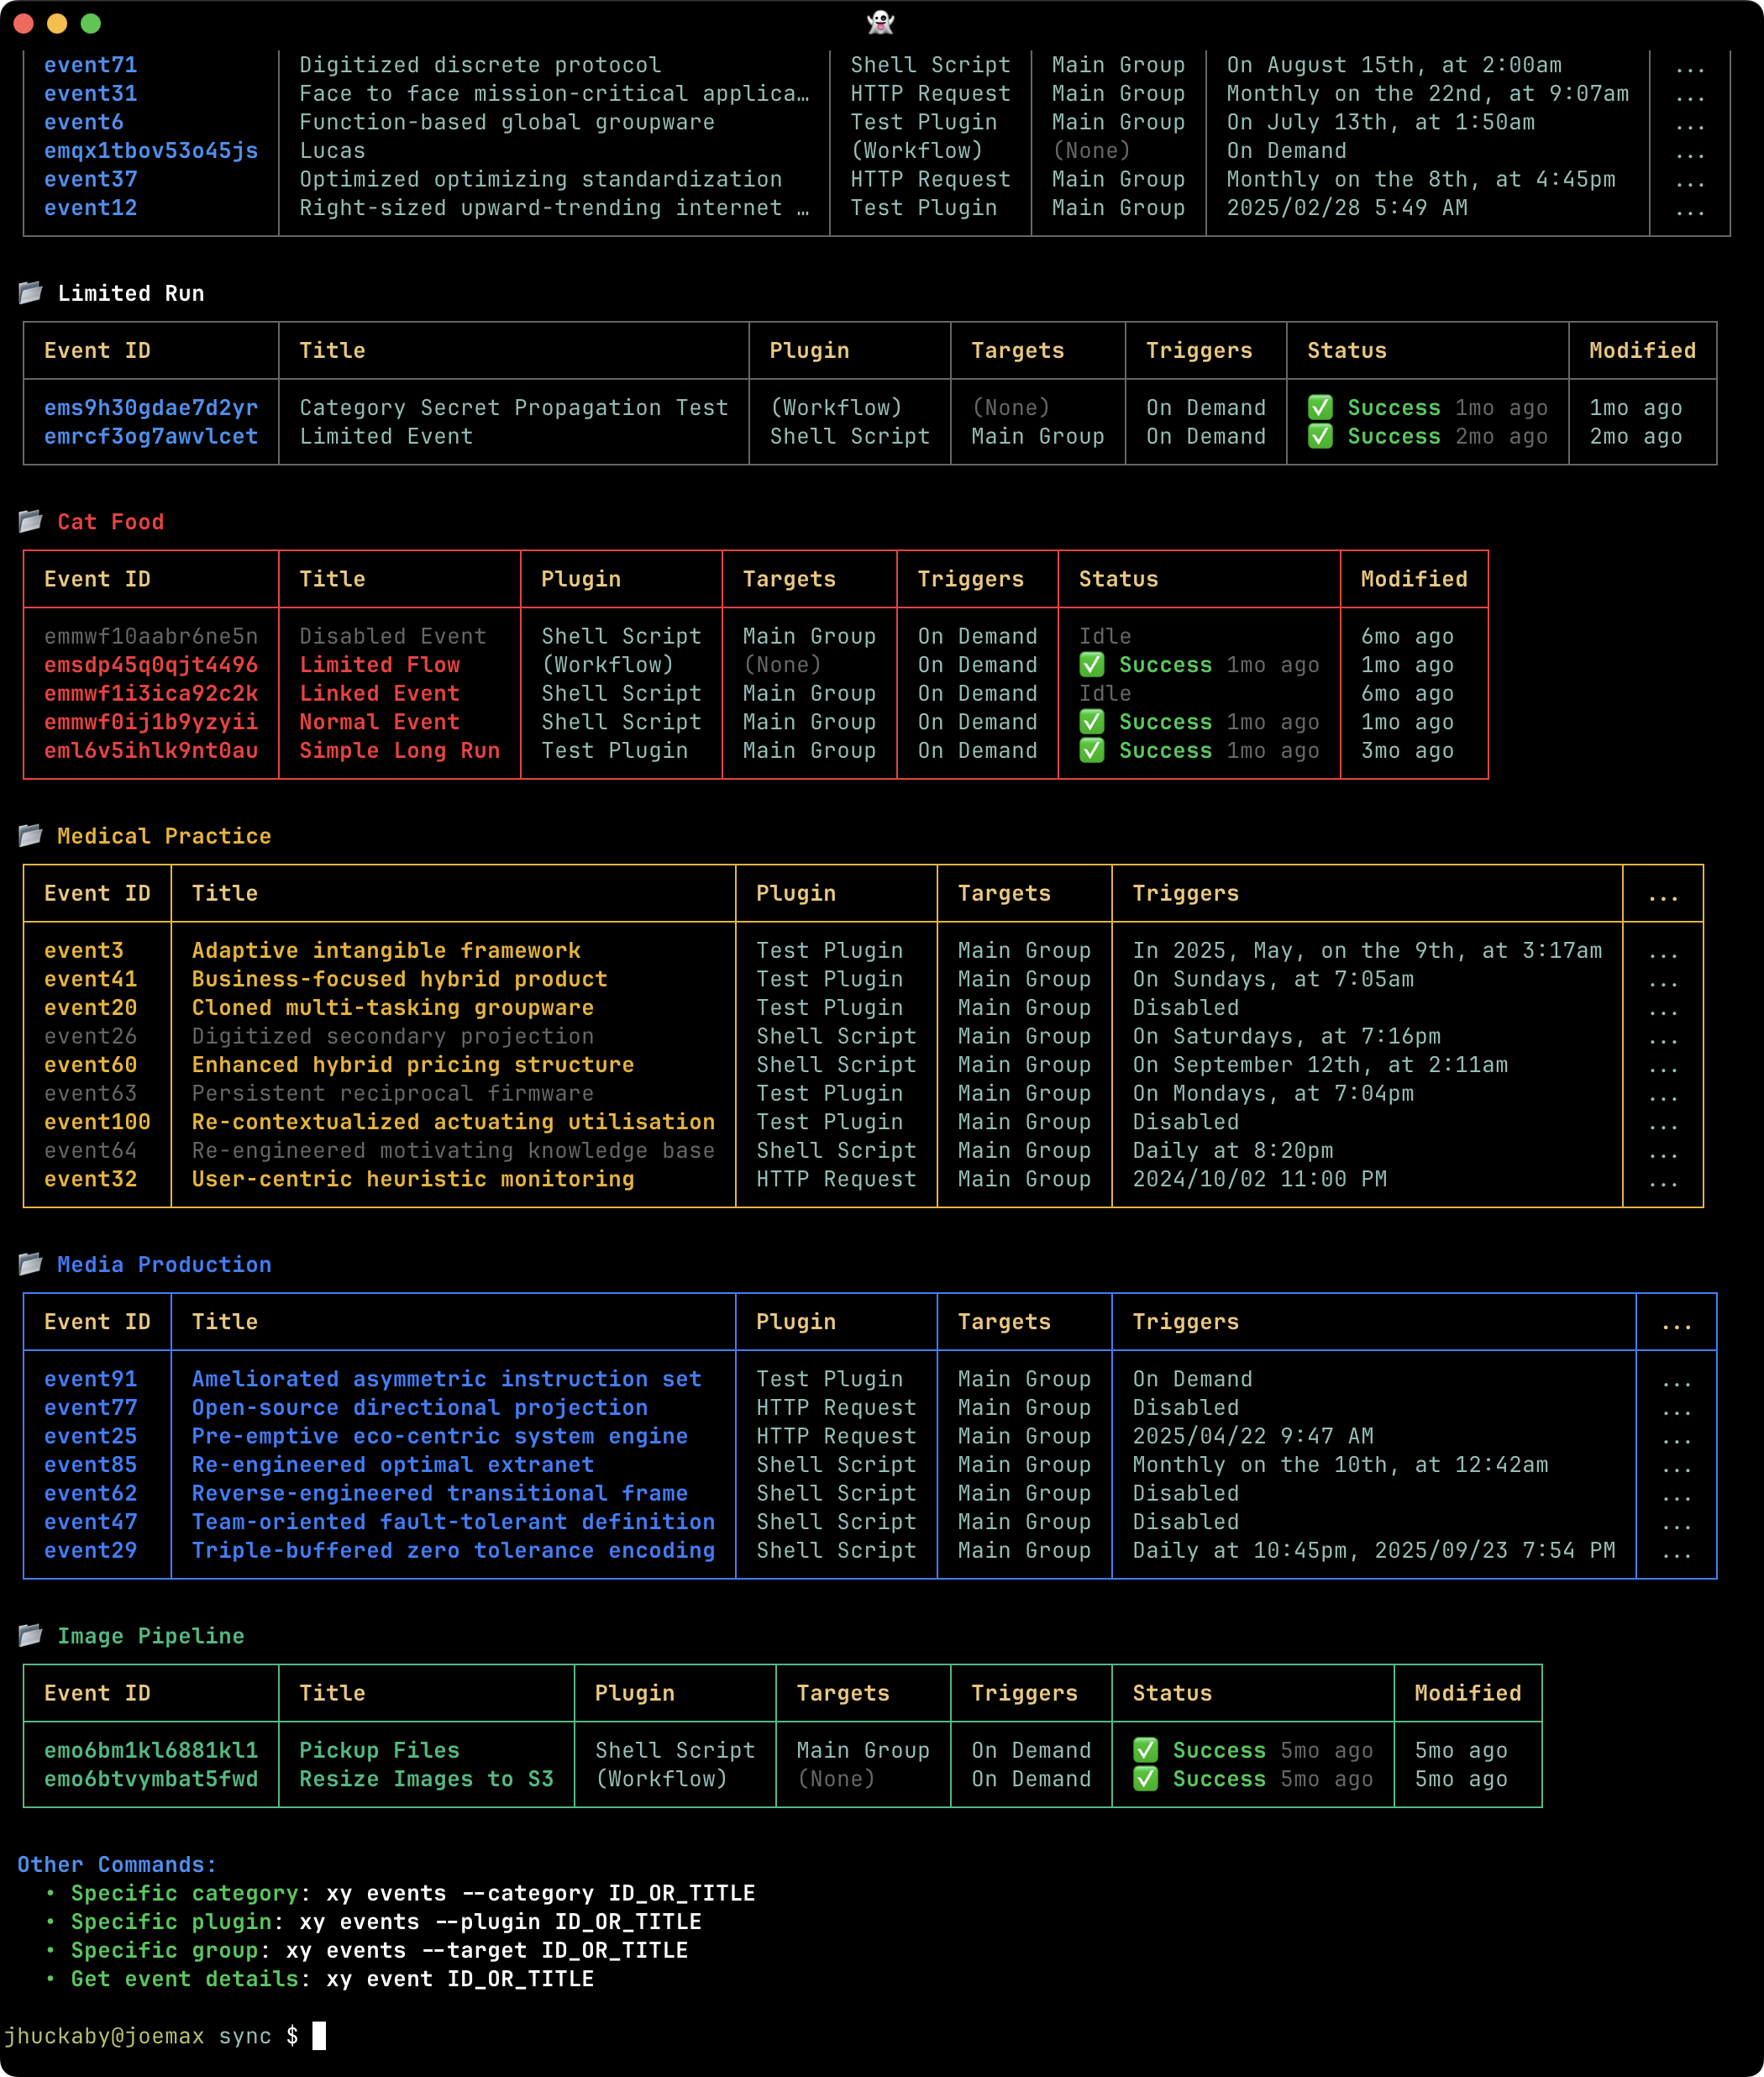
Browse Events by Category, with their Plugins, targets, schedules, and current activity.
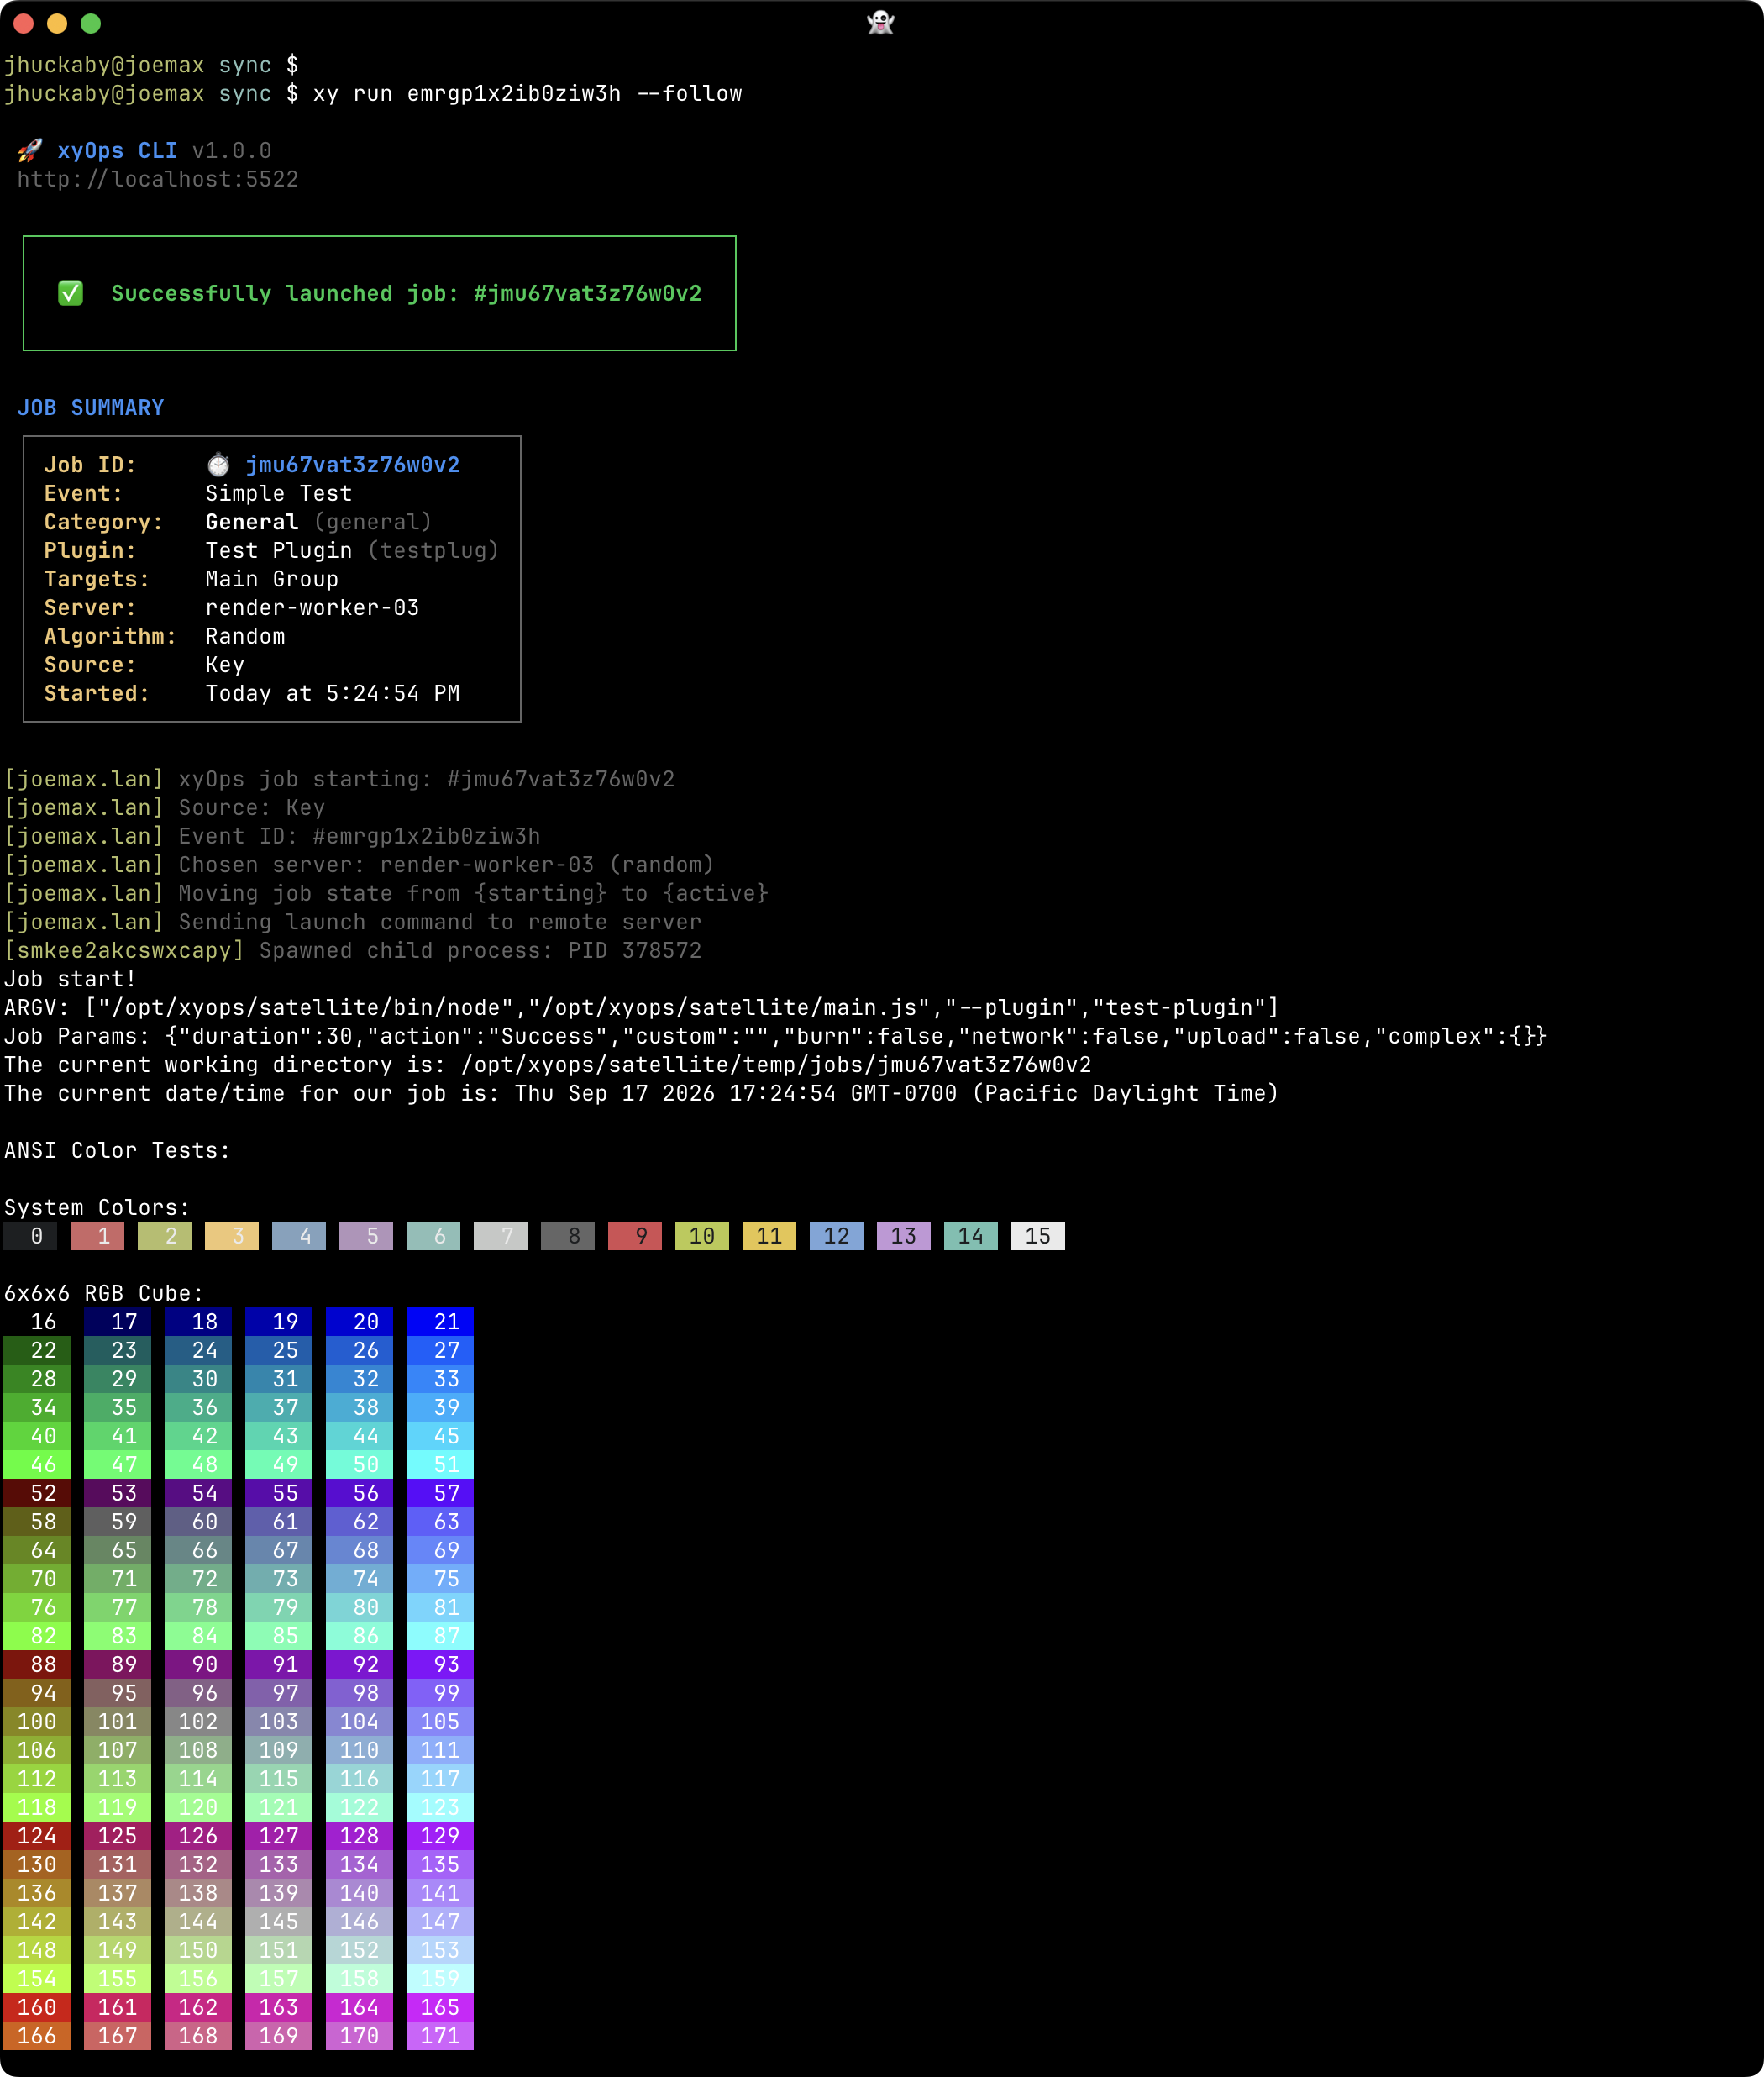
Launch an Event and follow its output through to the completed job report.
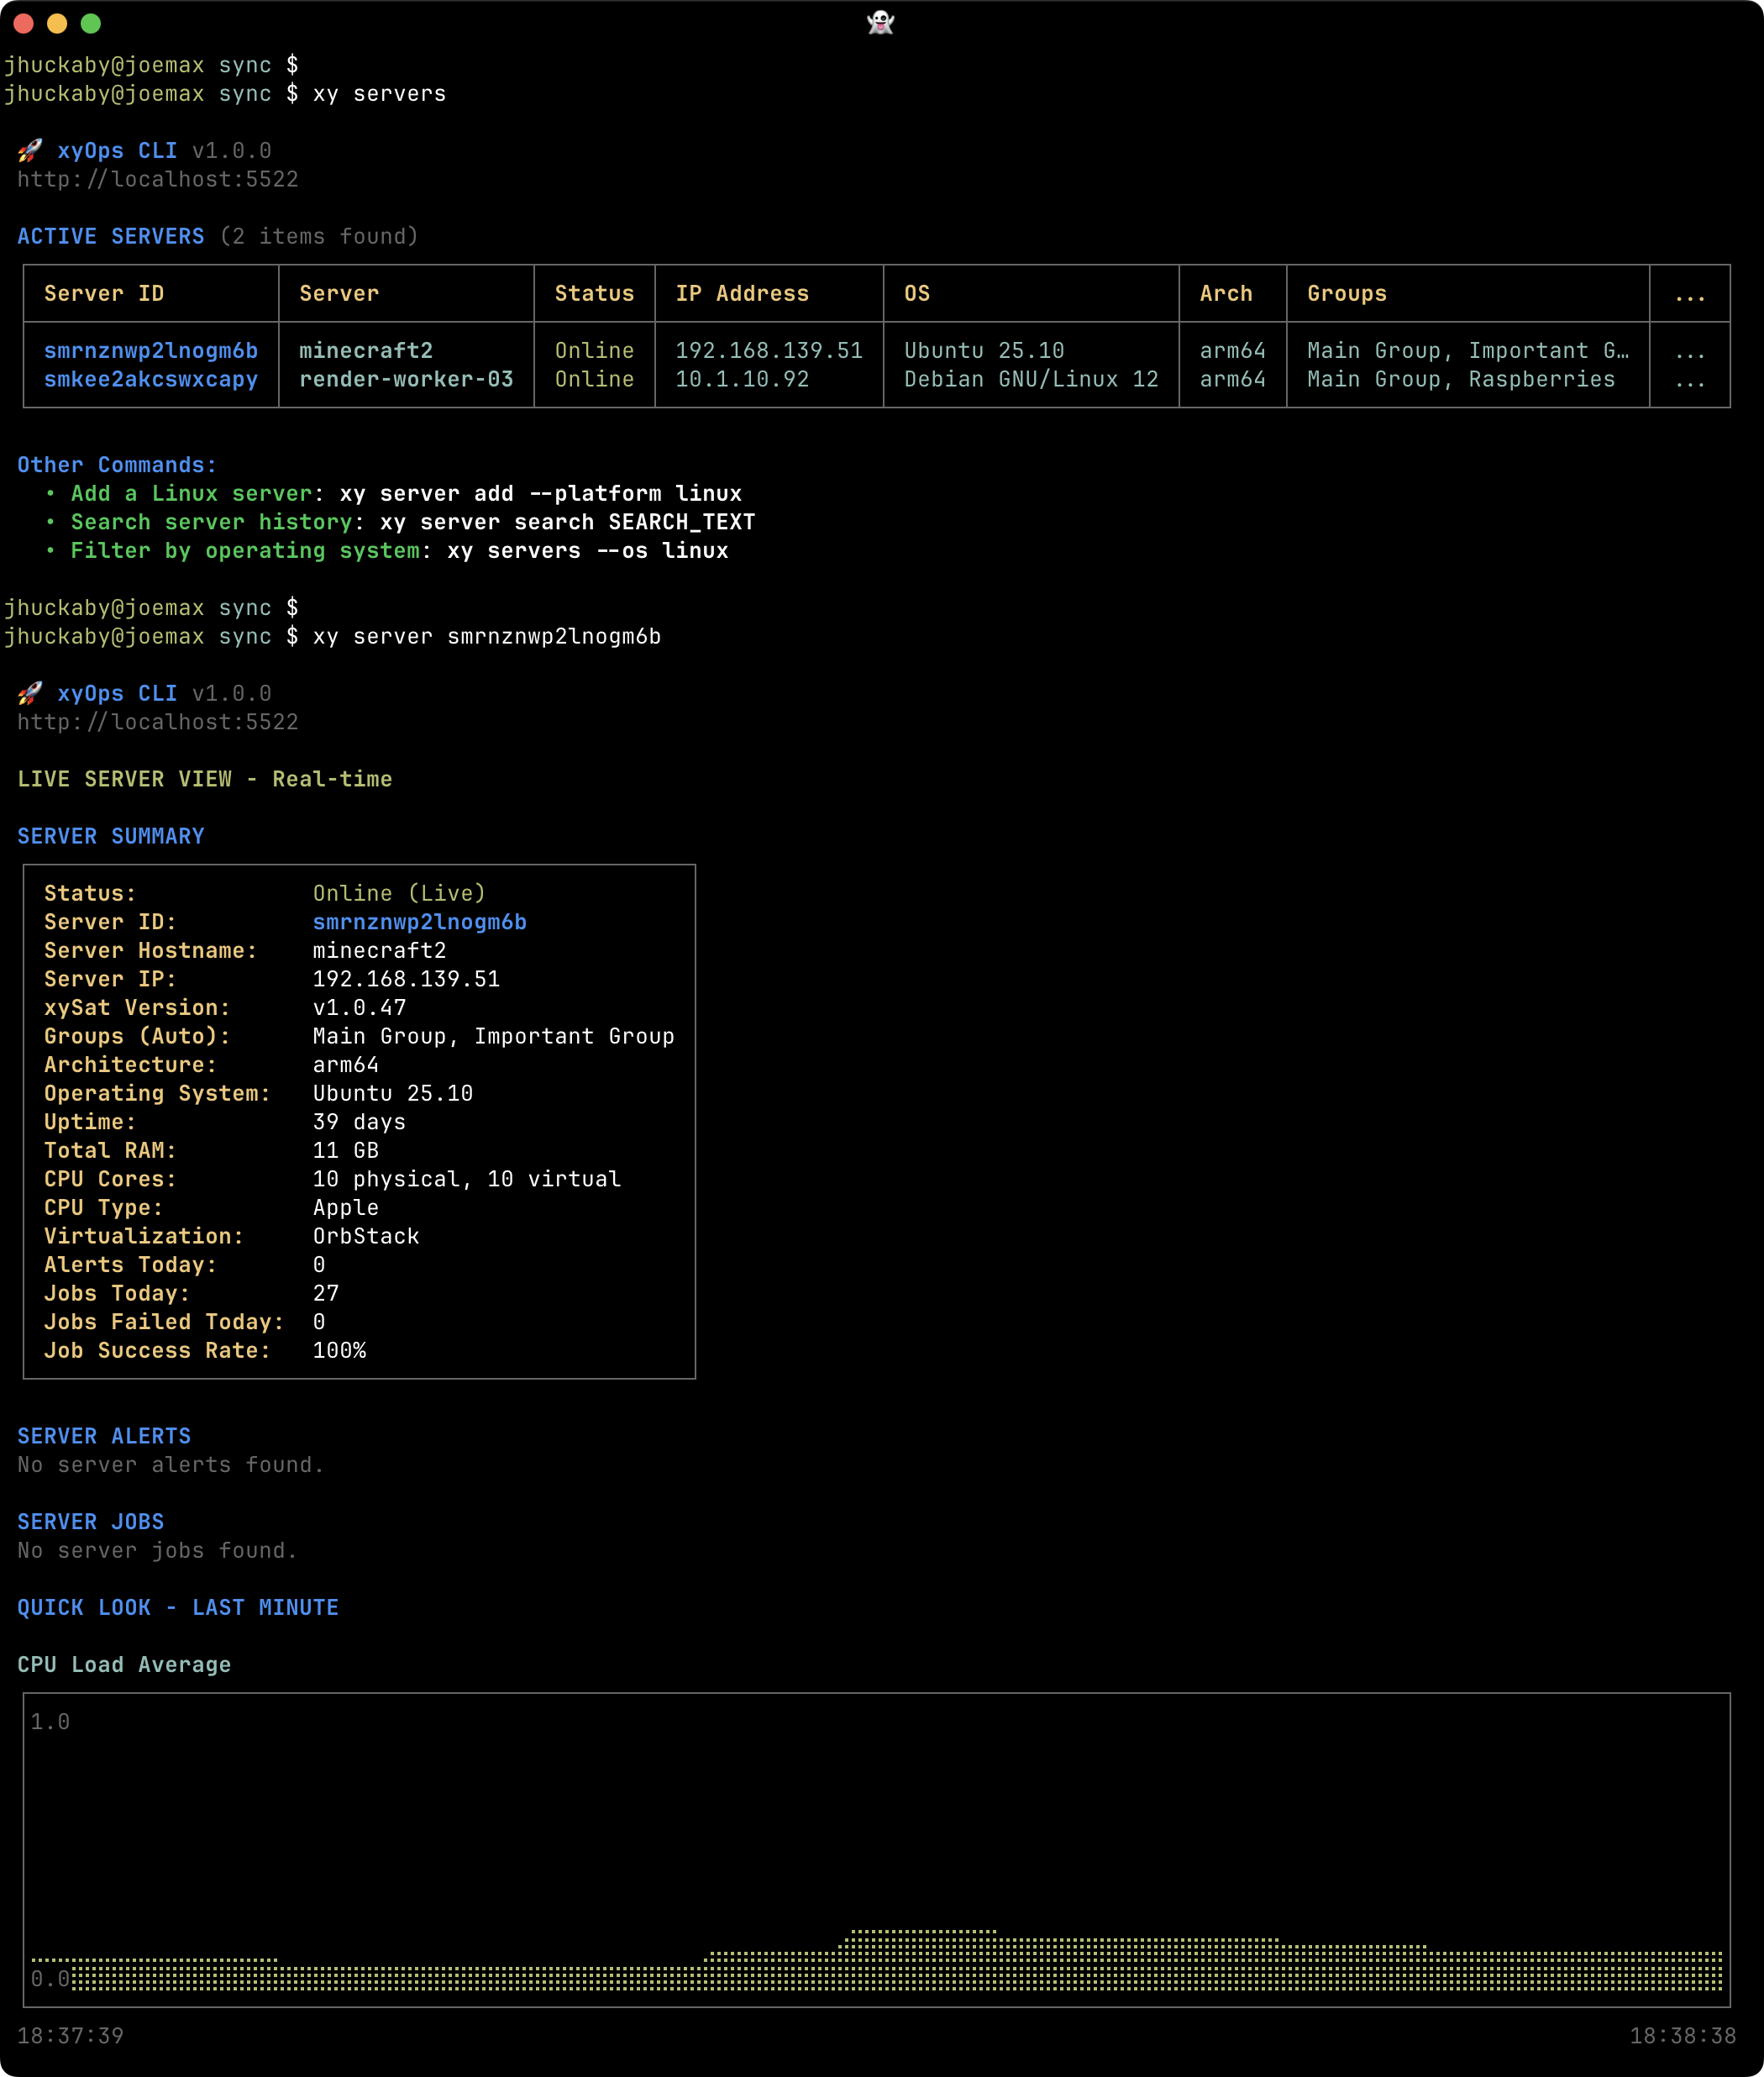
Find workers and drill into a server's system information and current activity.
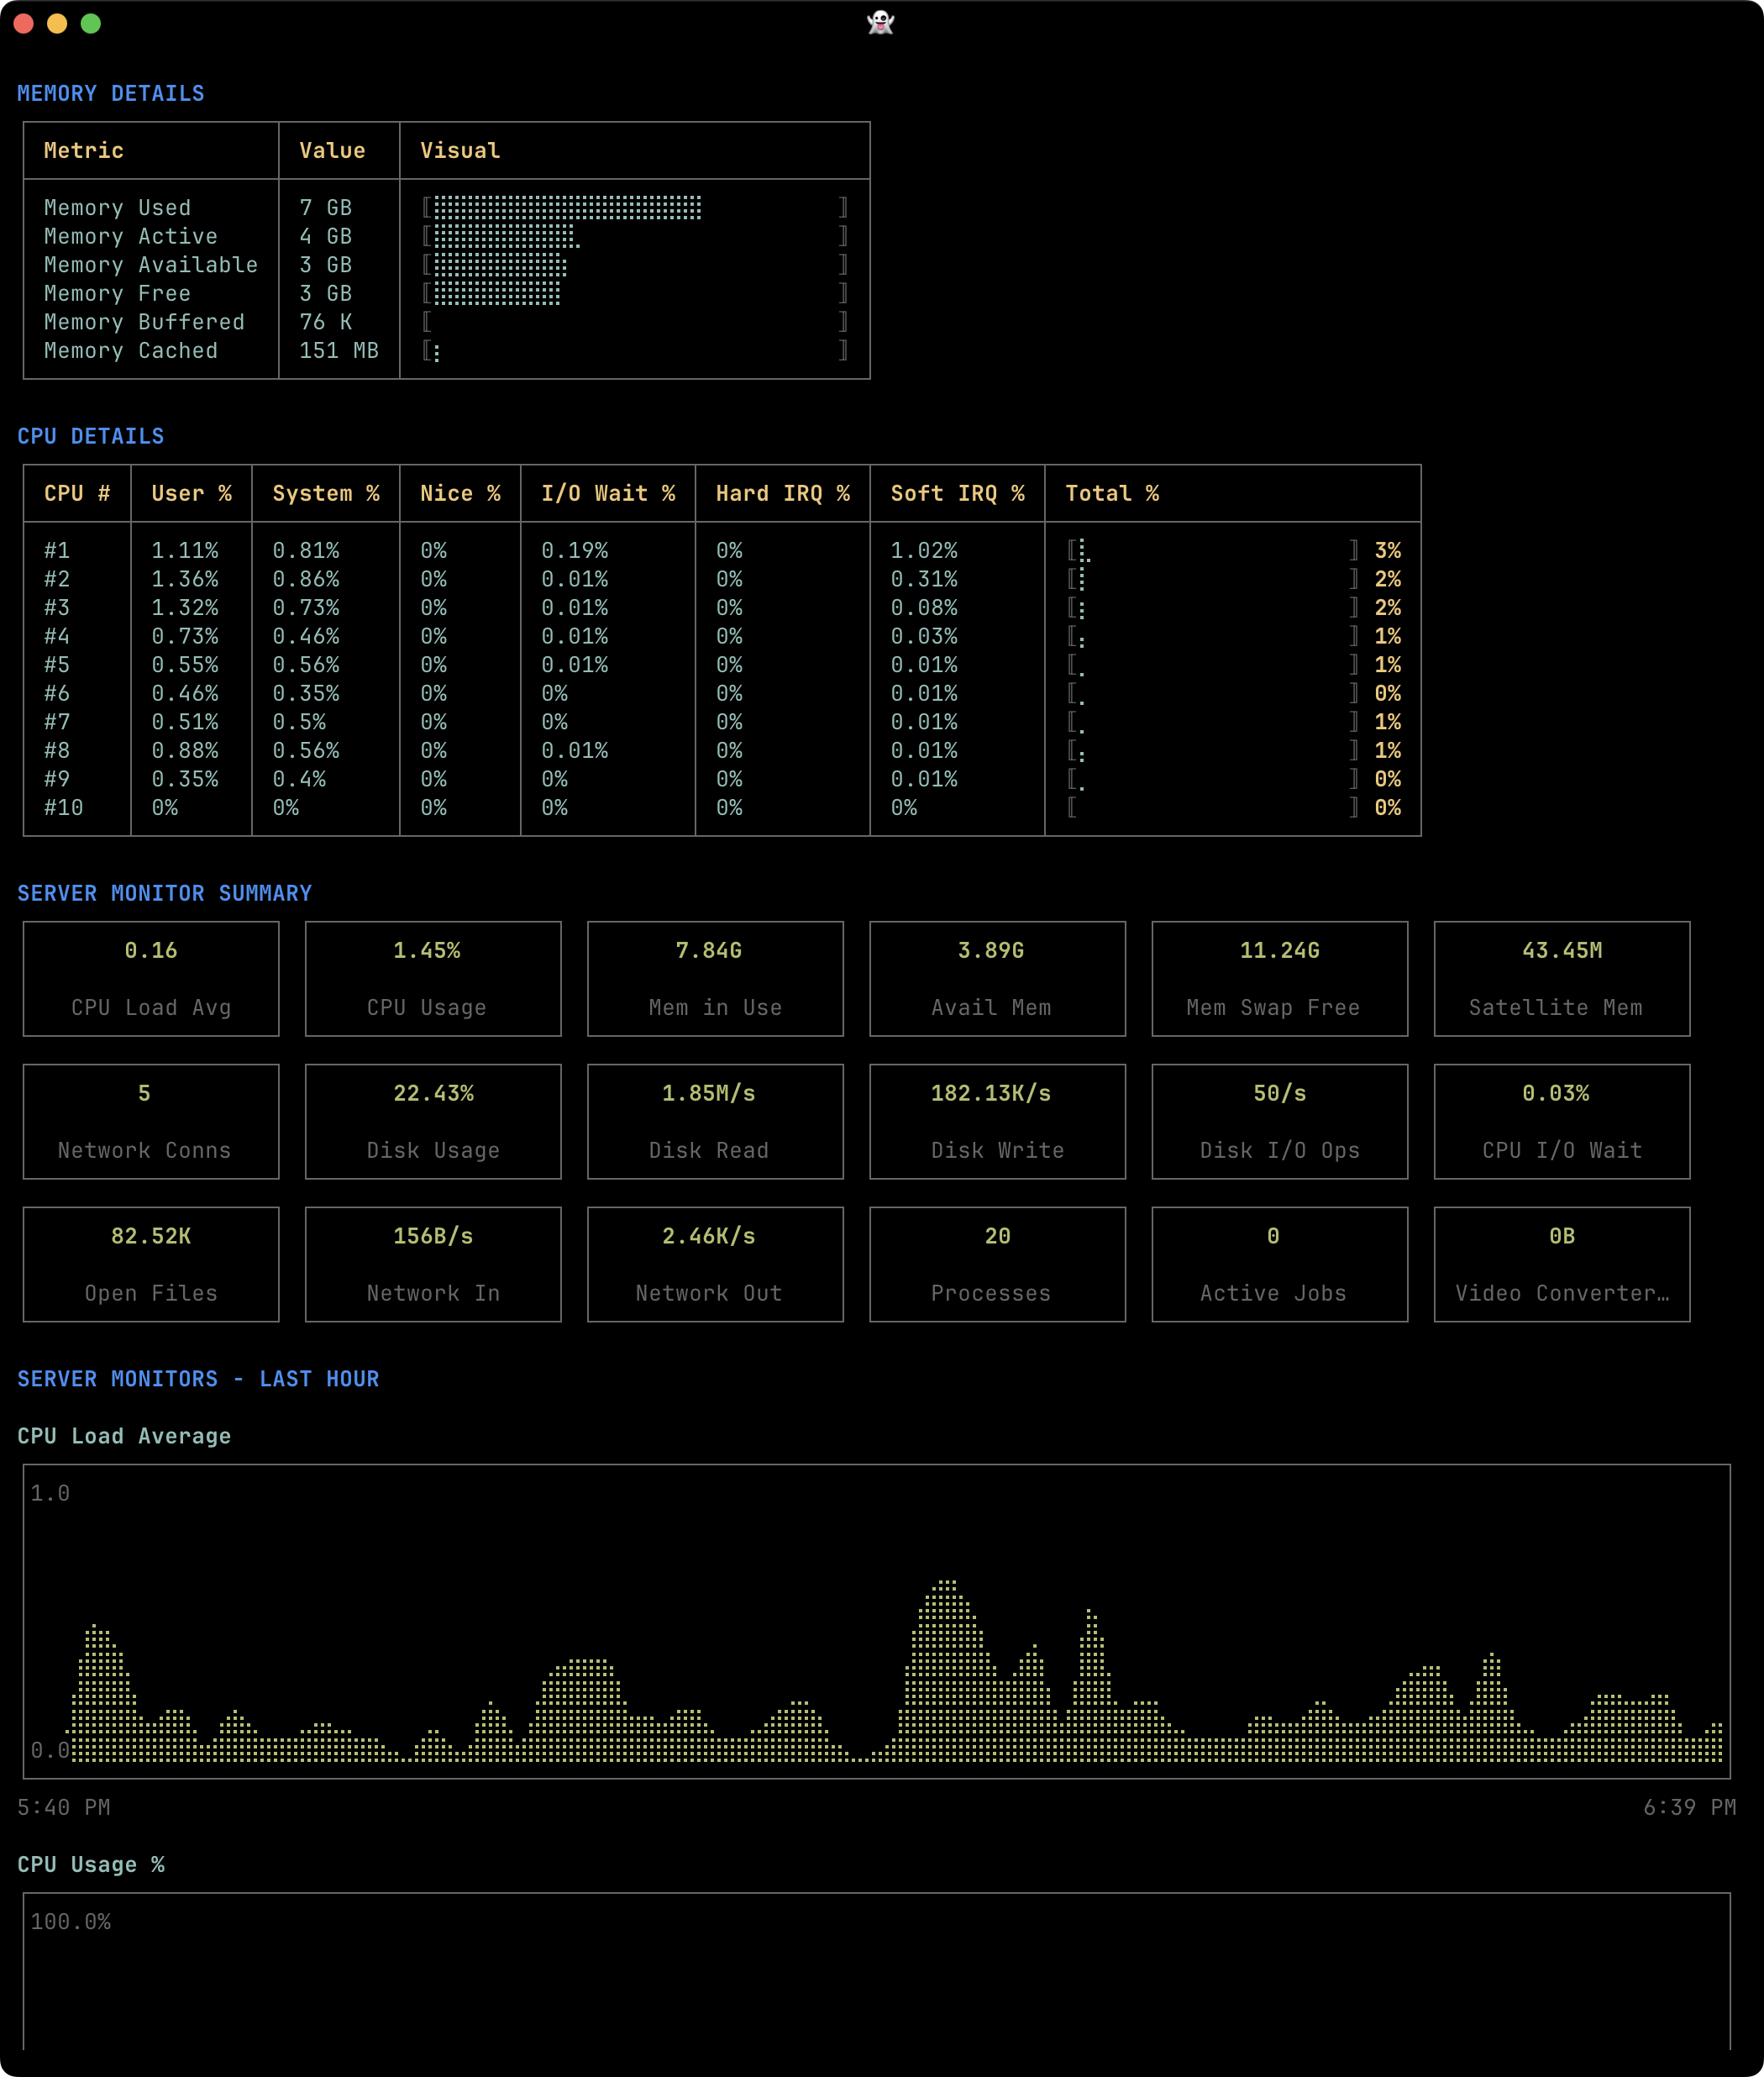
Explore memory usage, CPU details, and Quick Look charts for a single worker.
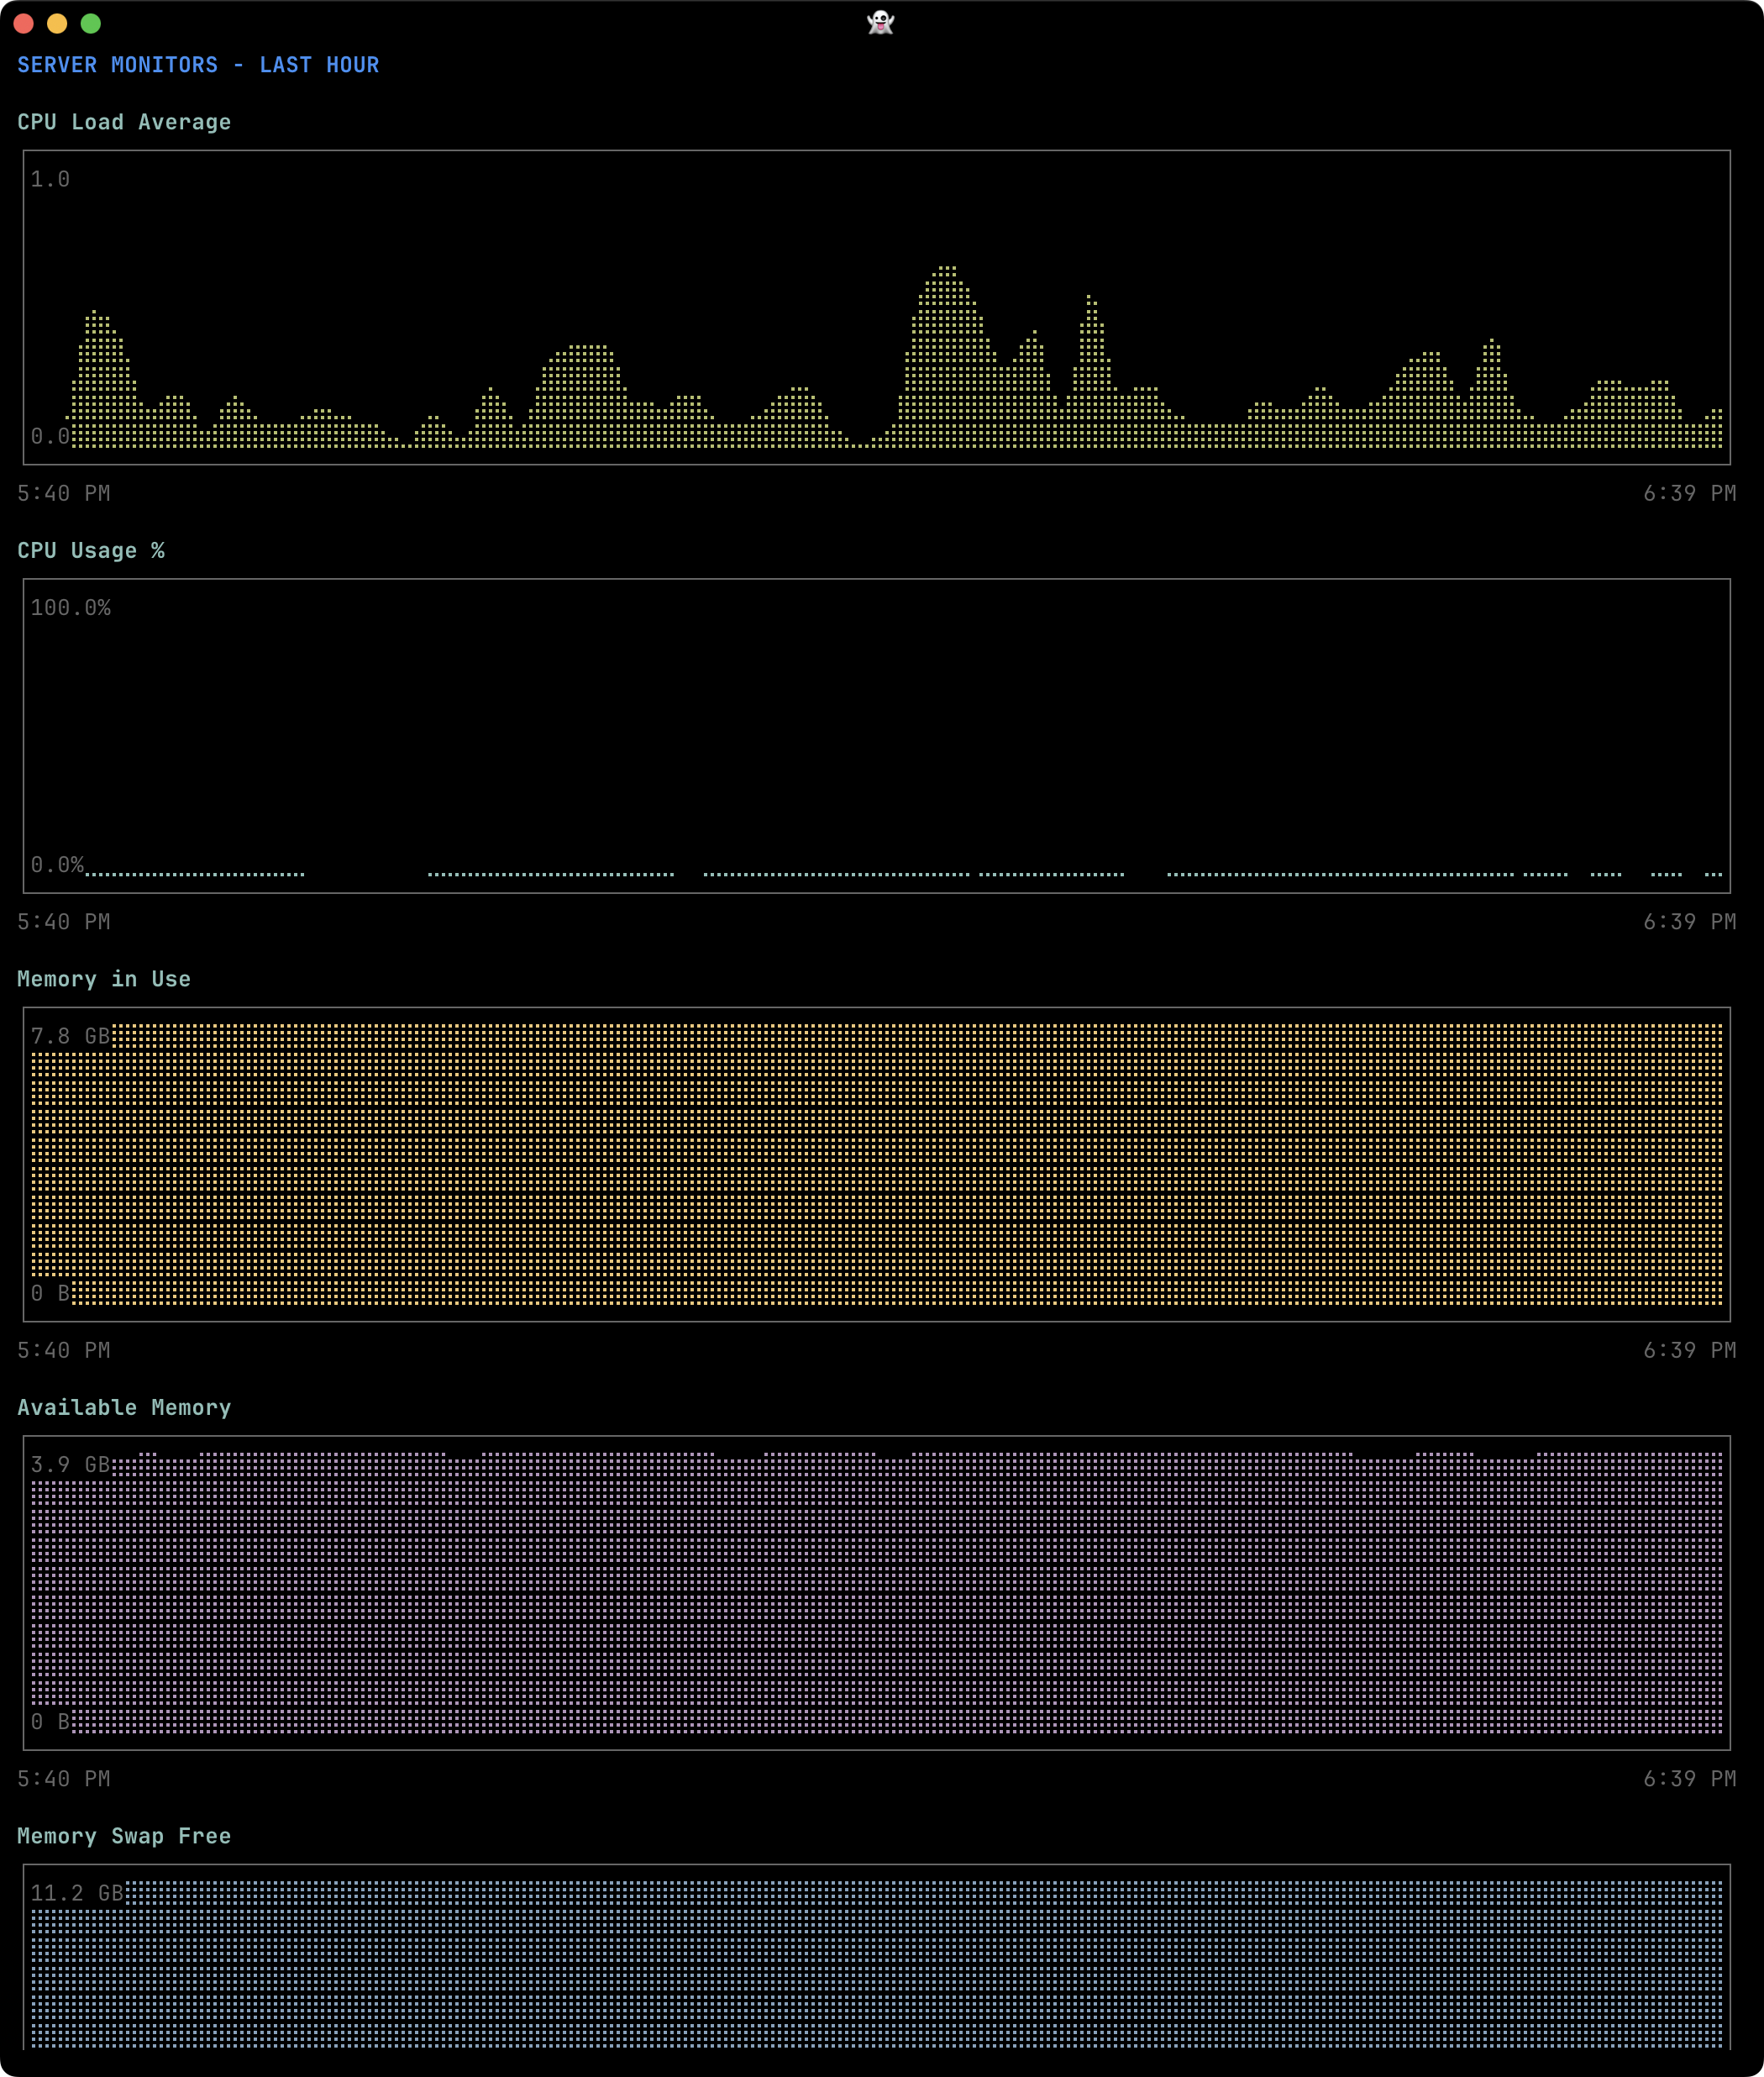
Chart a server's collected metrics directly in the terminal.
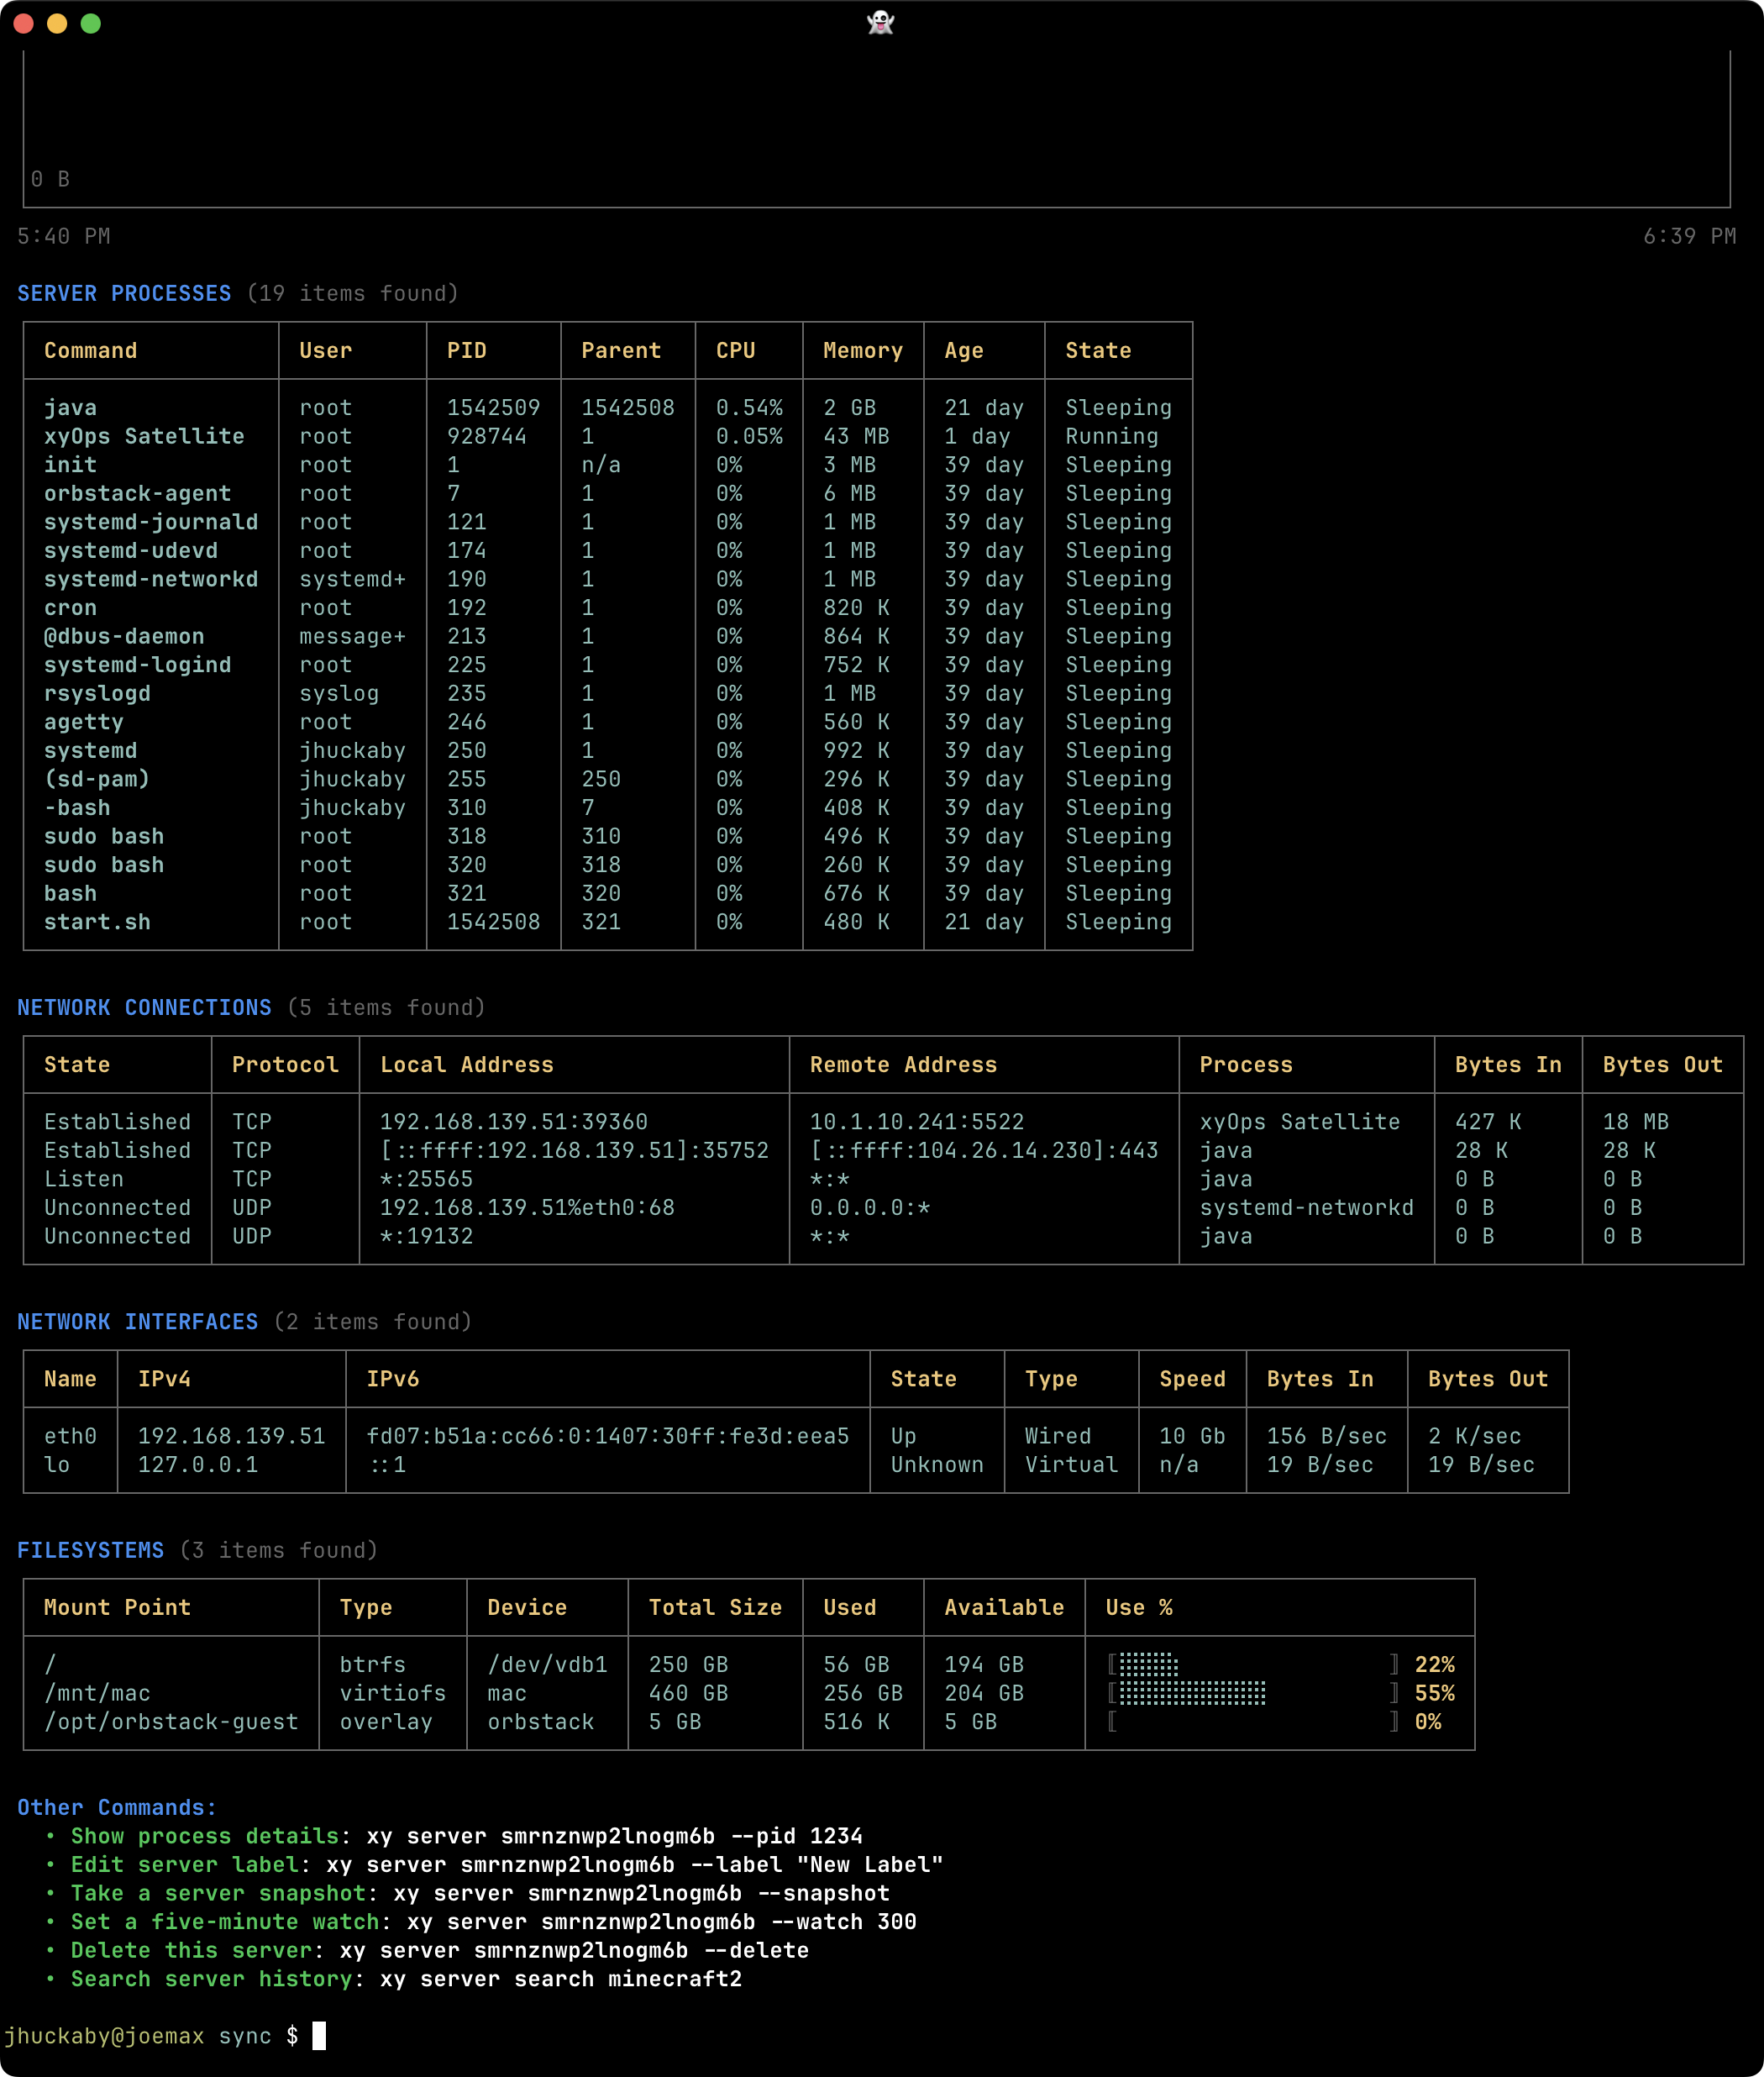
Inspect running processes and network connections alongside the server's monitoring context.
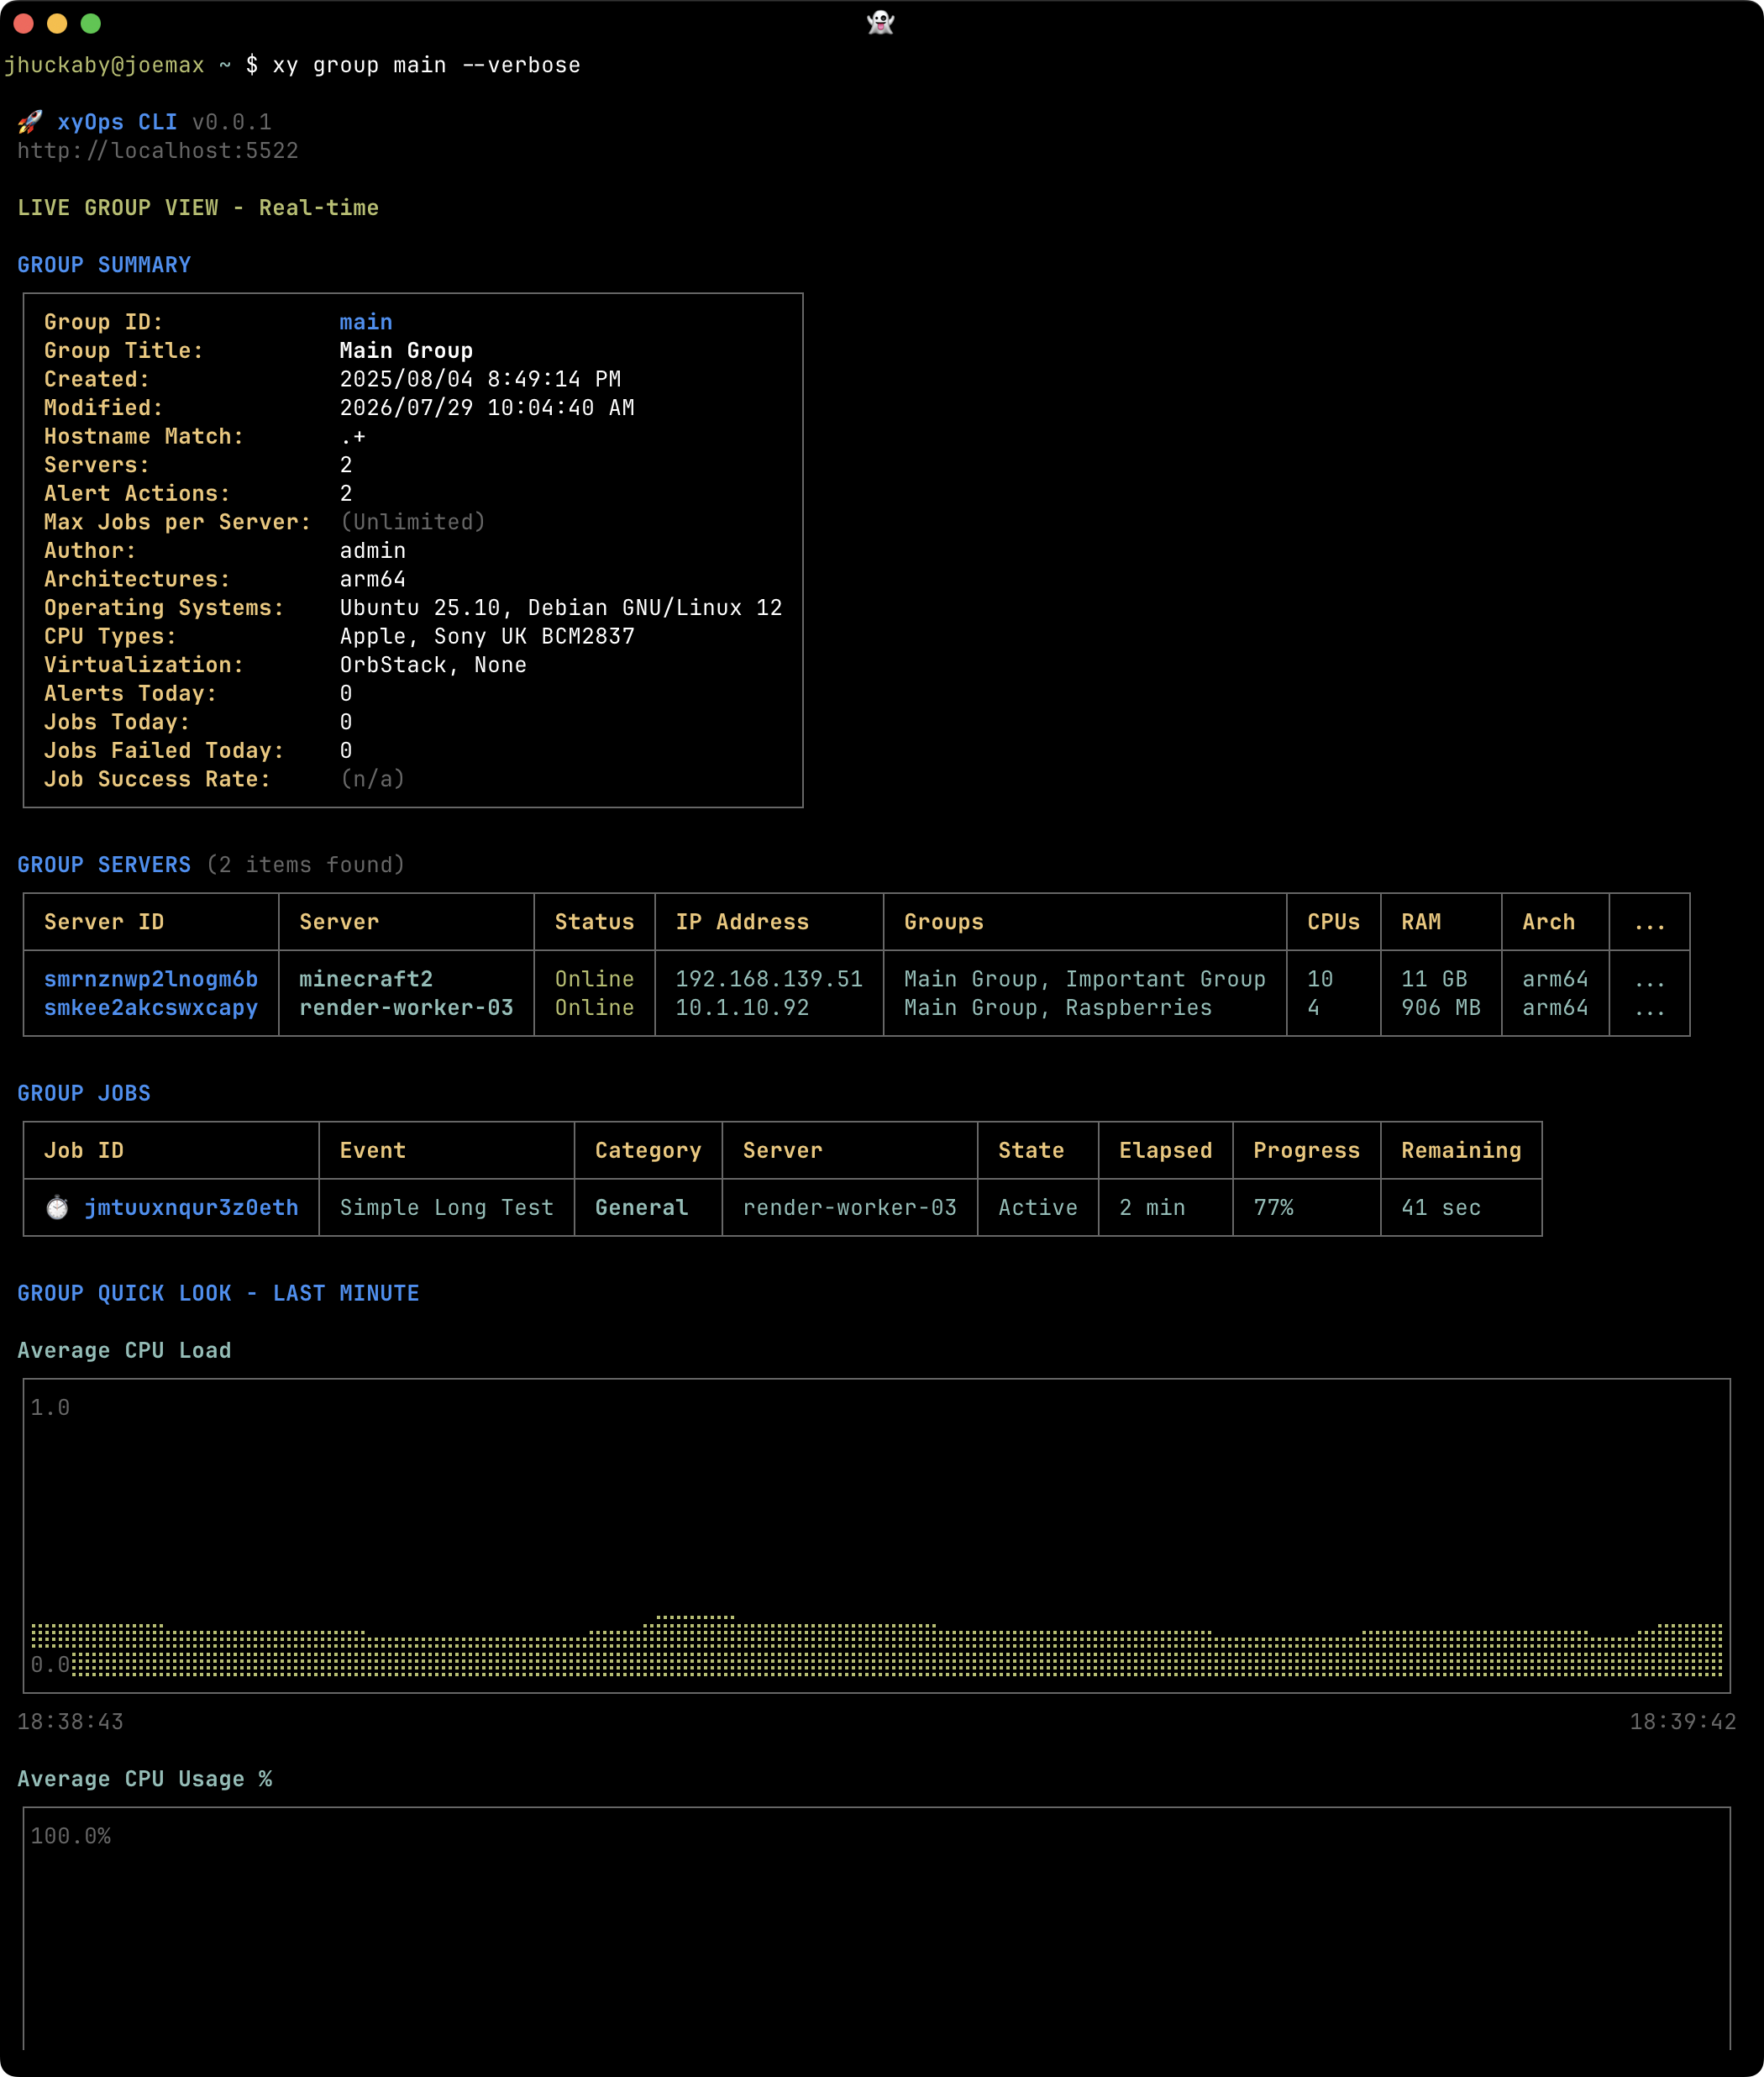
View Group settings and member servers together before exploring their combined health.
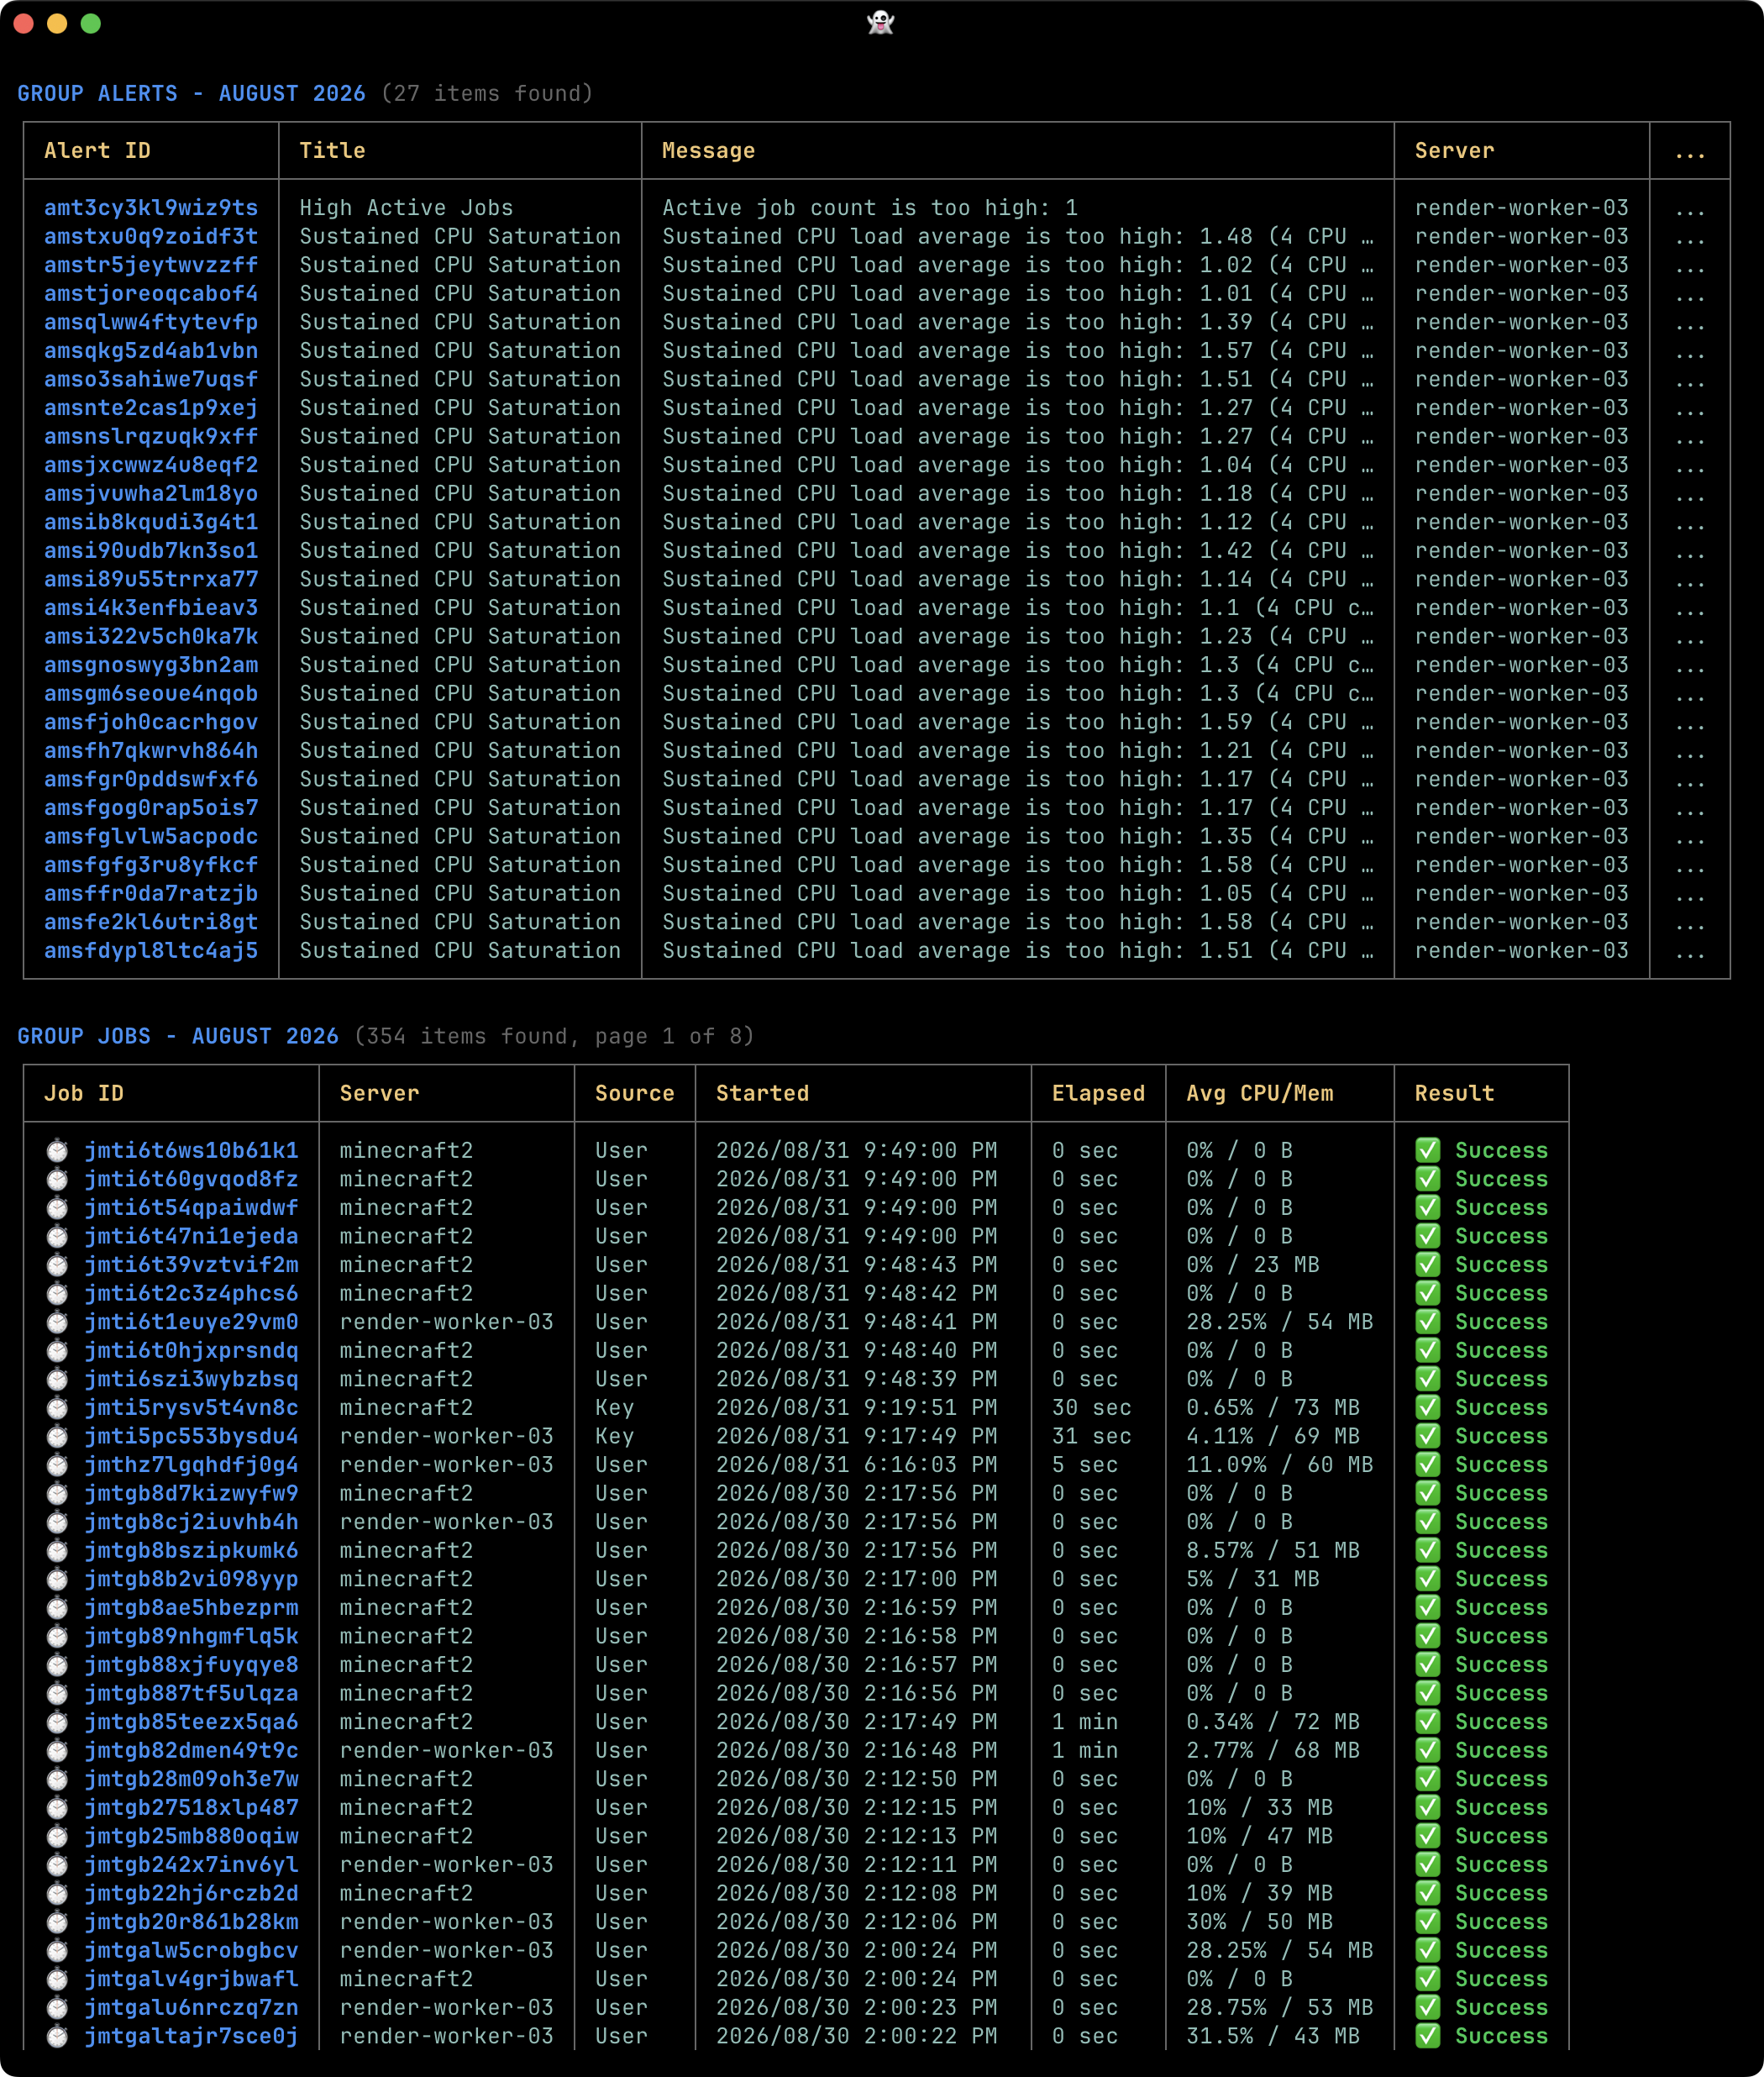
See active Alerts and jobs across a pool of workers in one combined view.
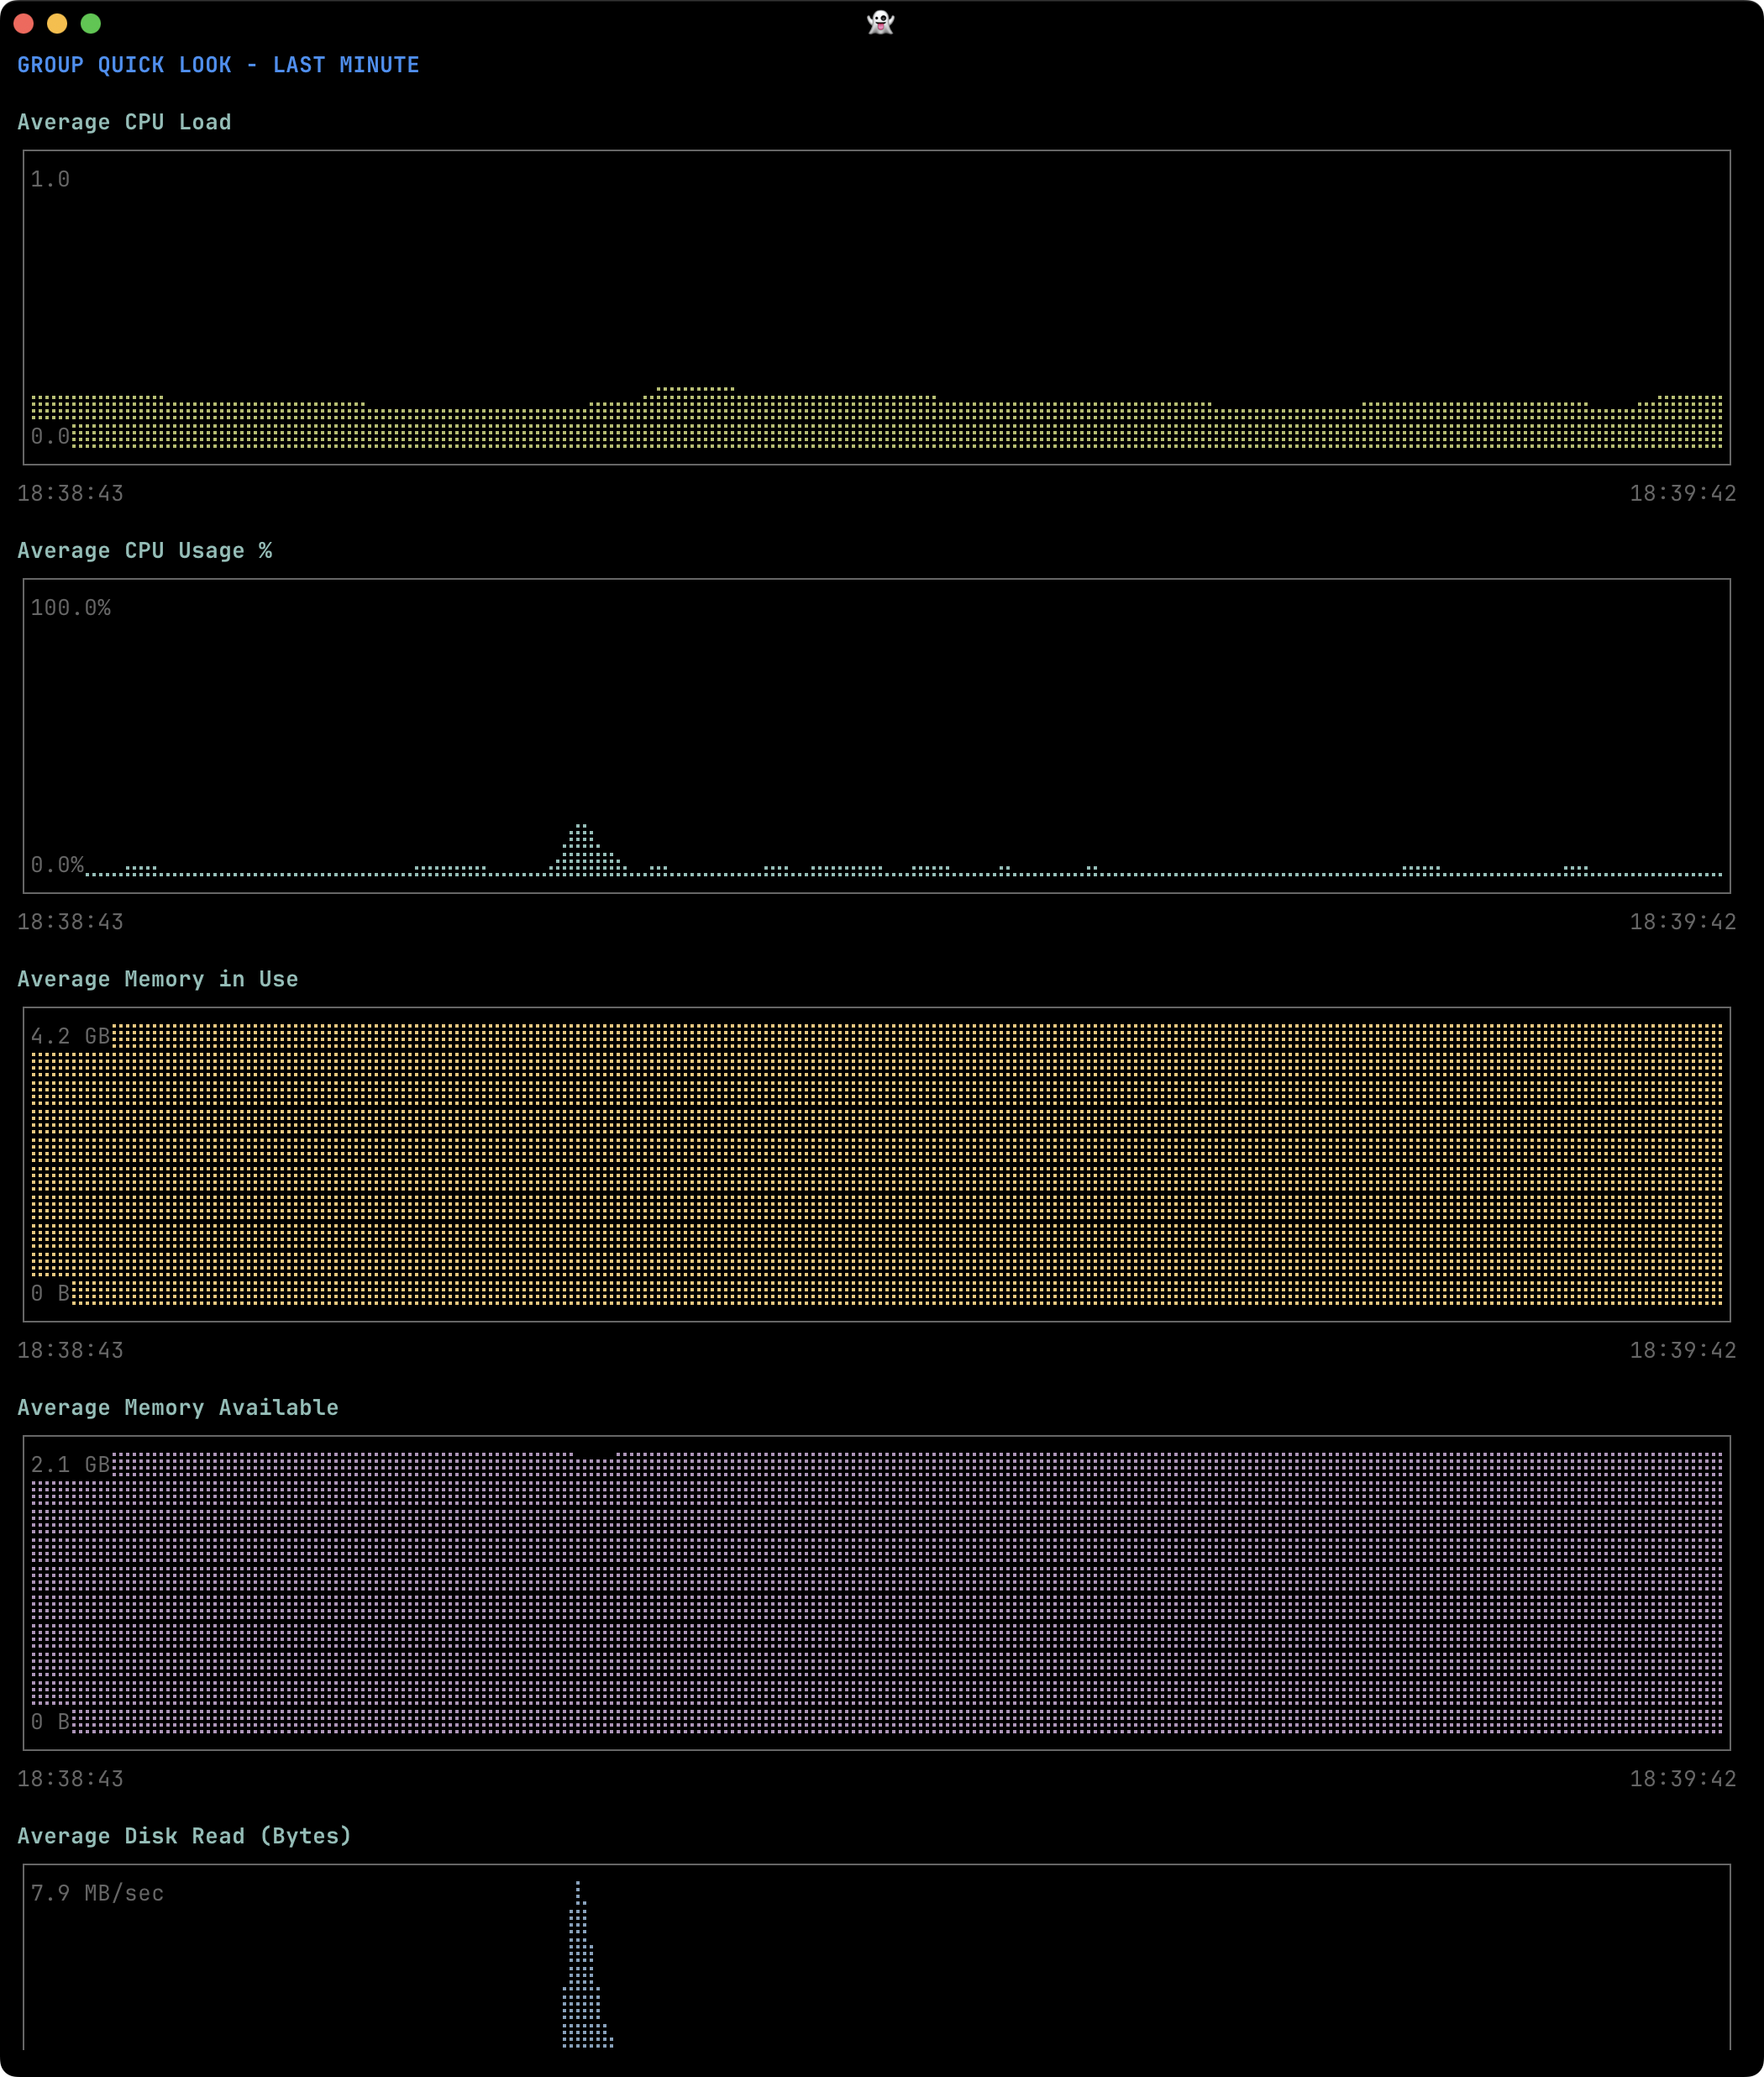
Explore short-term monitoring charts aggregated across the Group's servers.
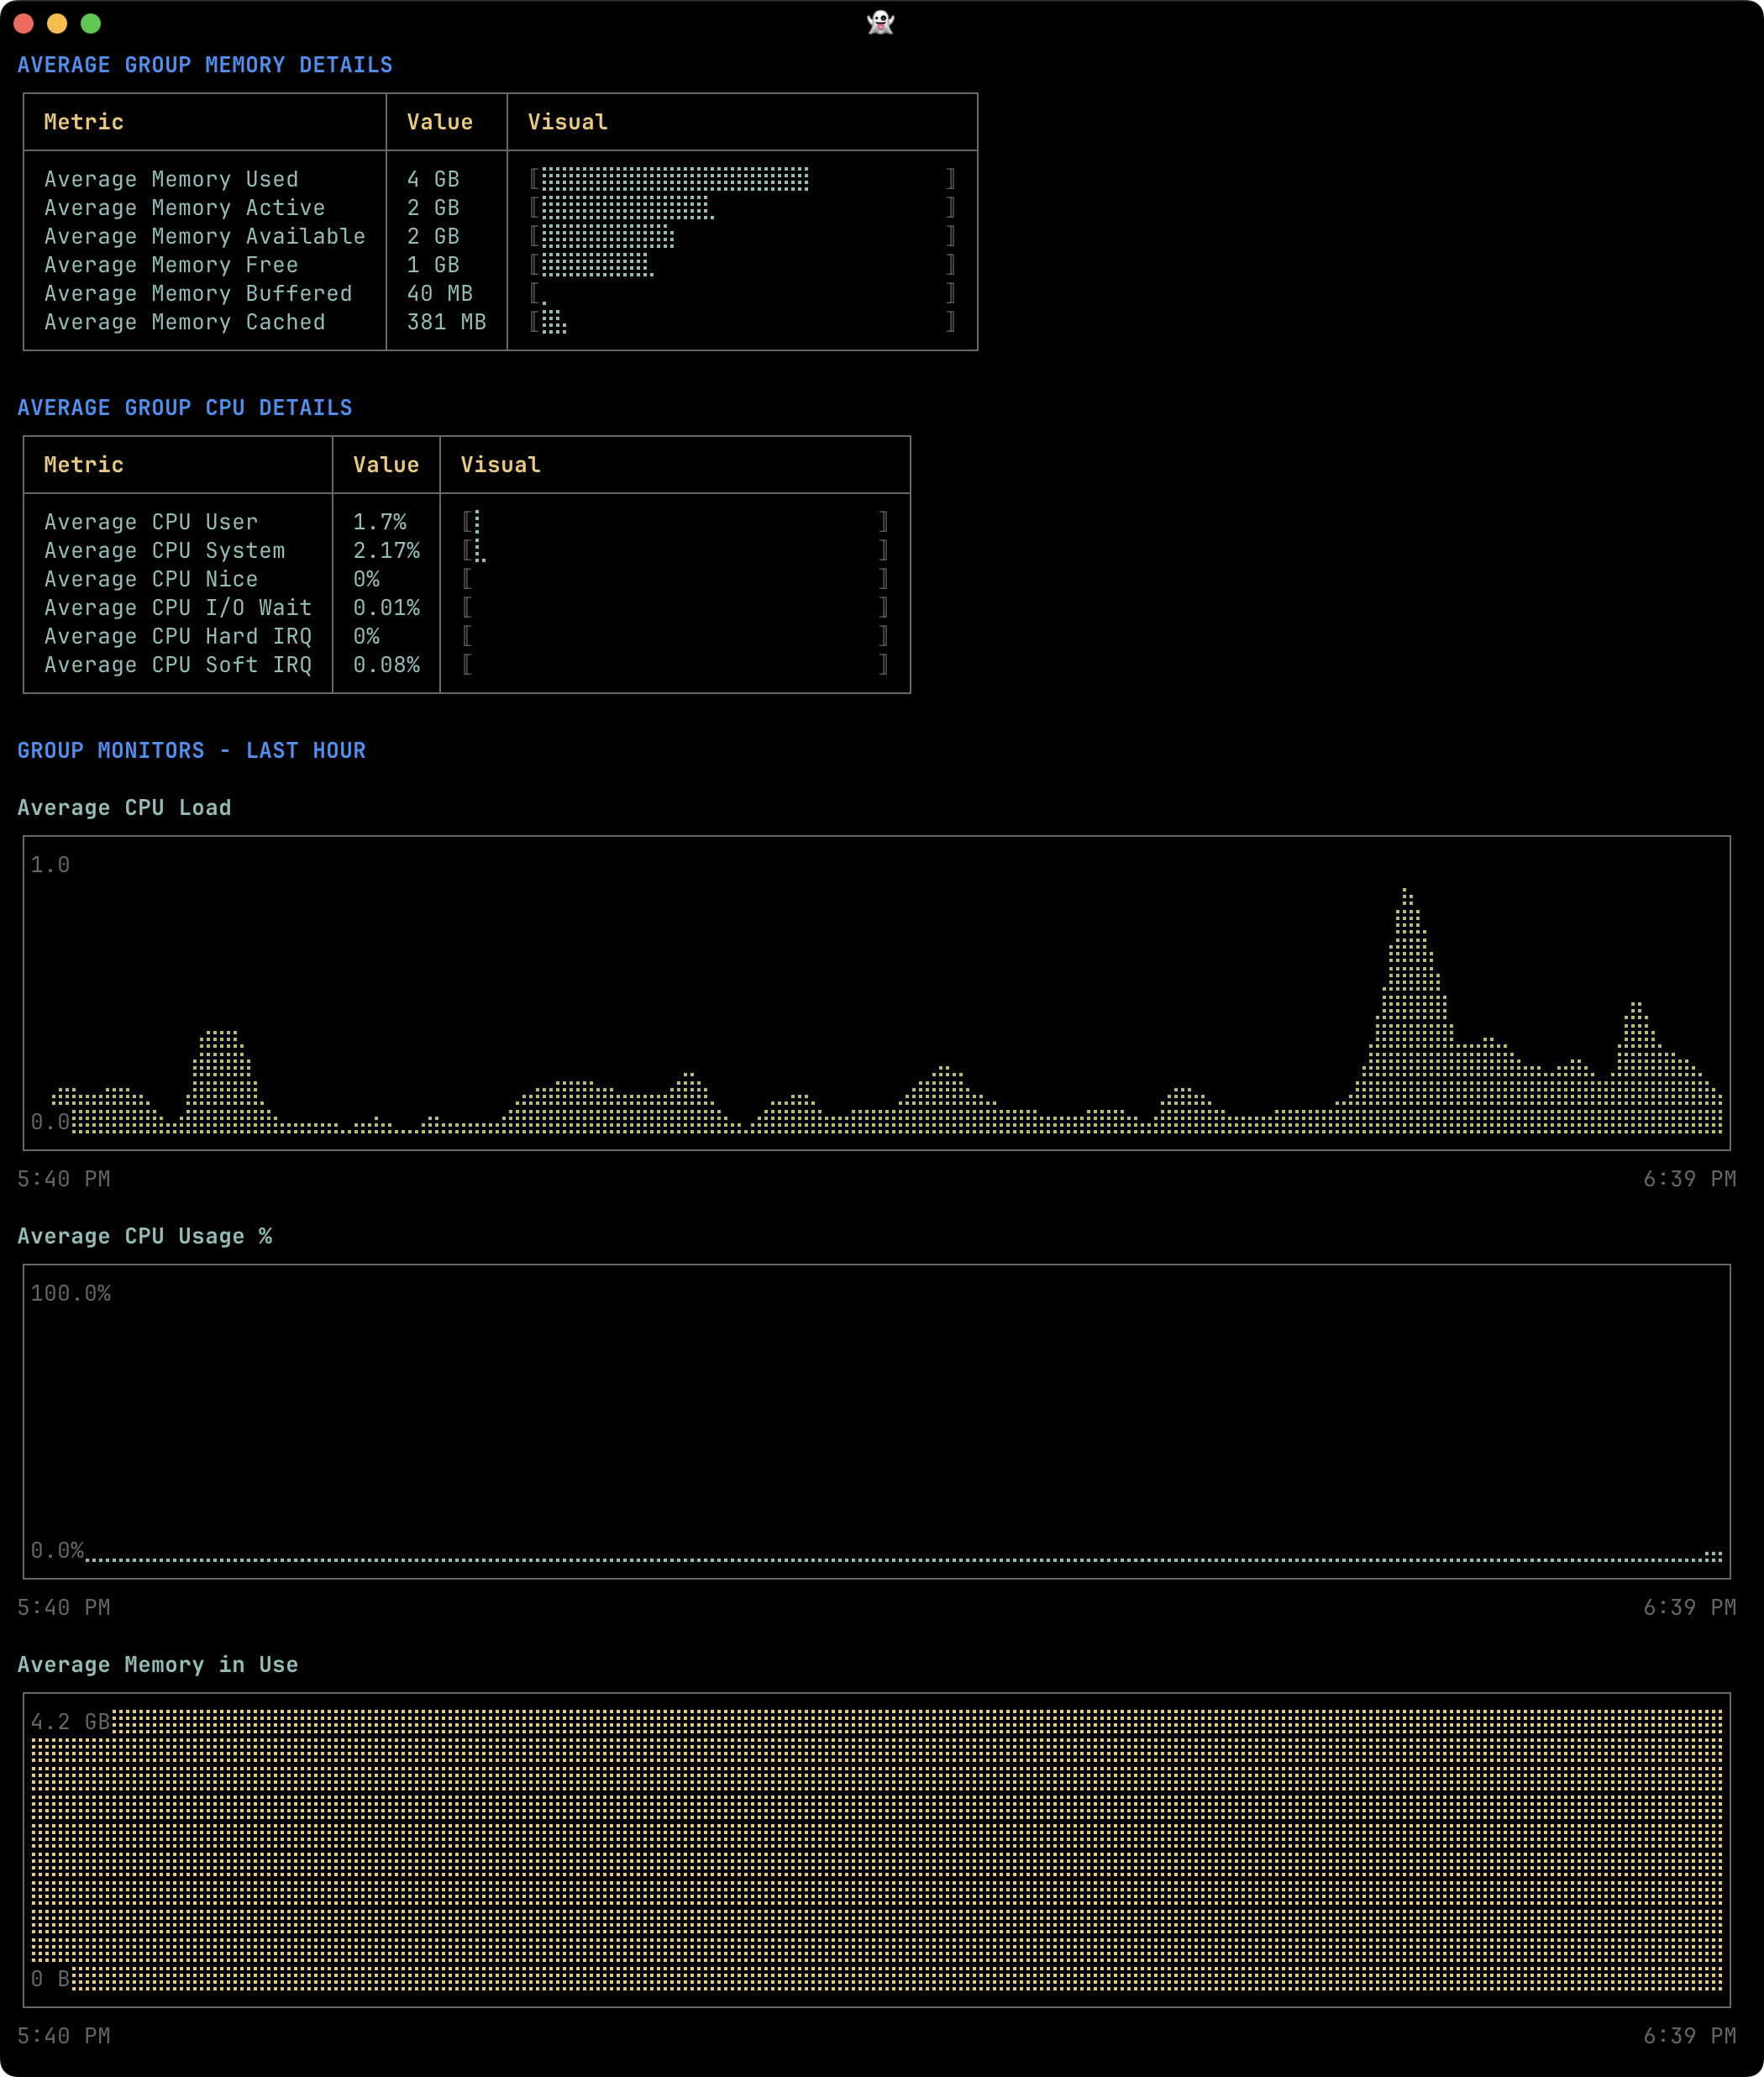
Follow the Group's collected metrics with terminal charts for each Monitor.
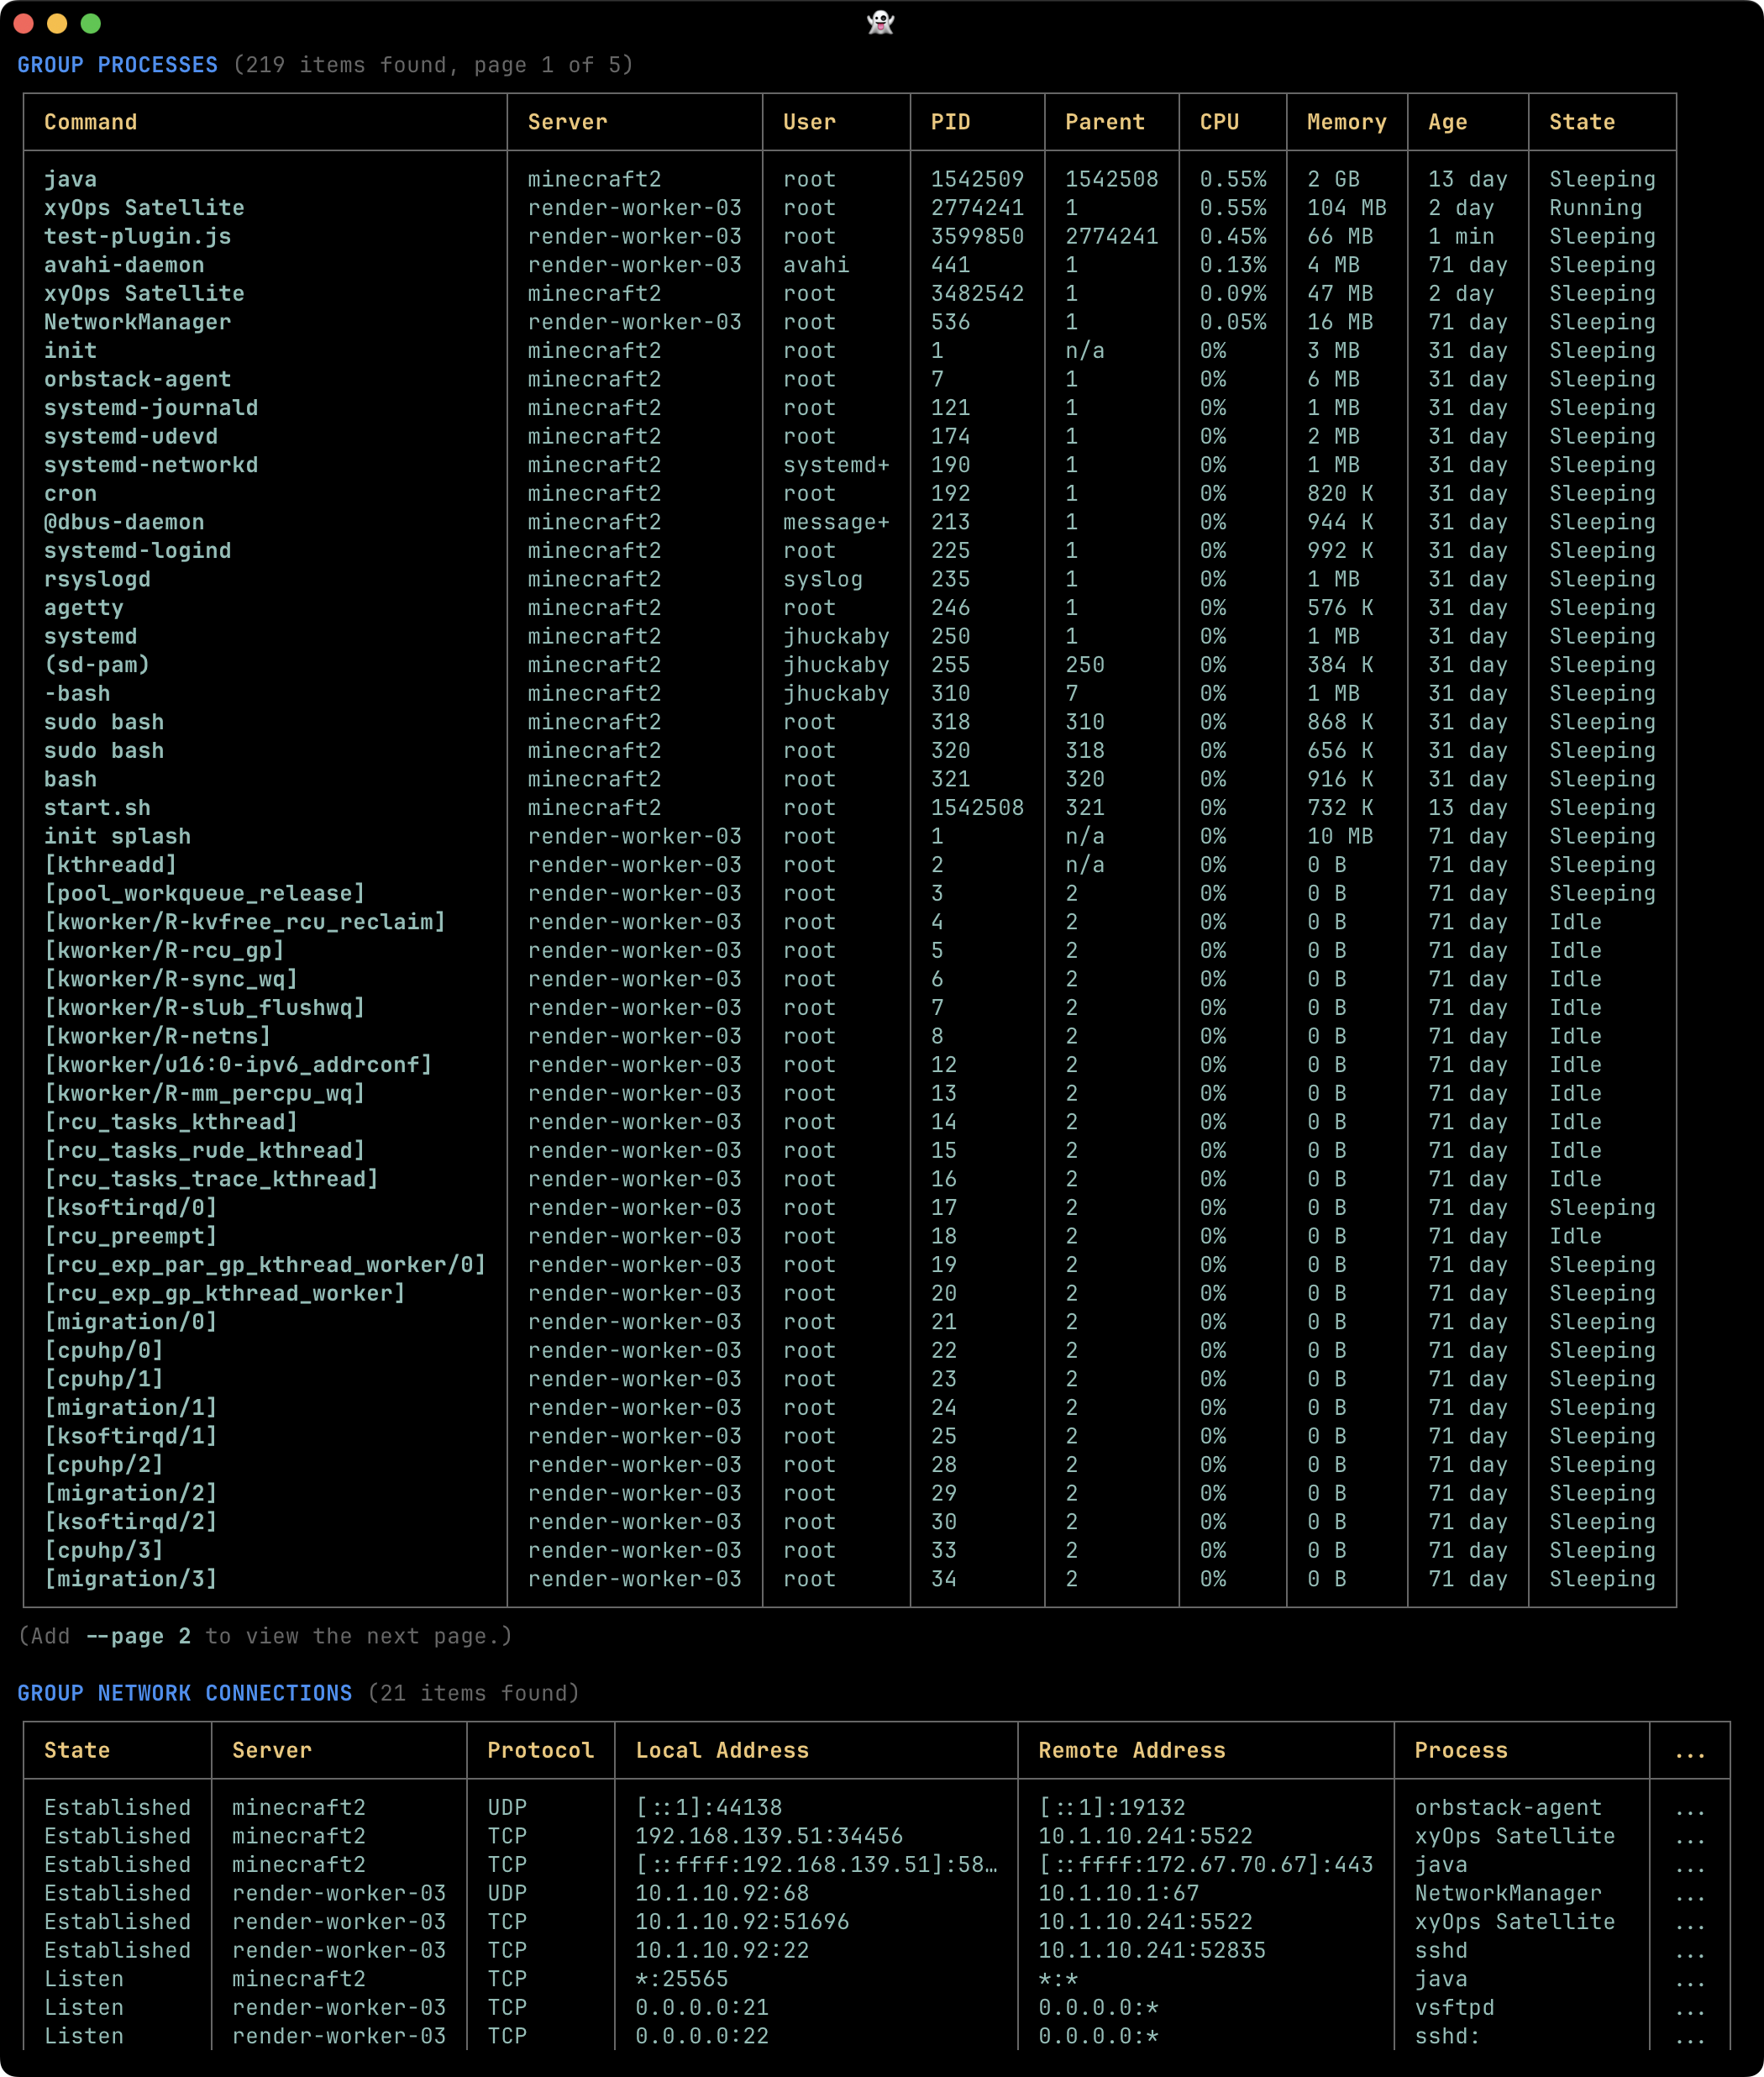
Compare processes across member servers to spot busy applications and unusual resource usage.
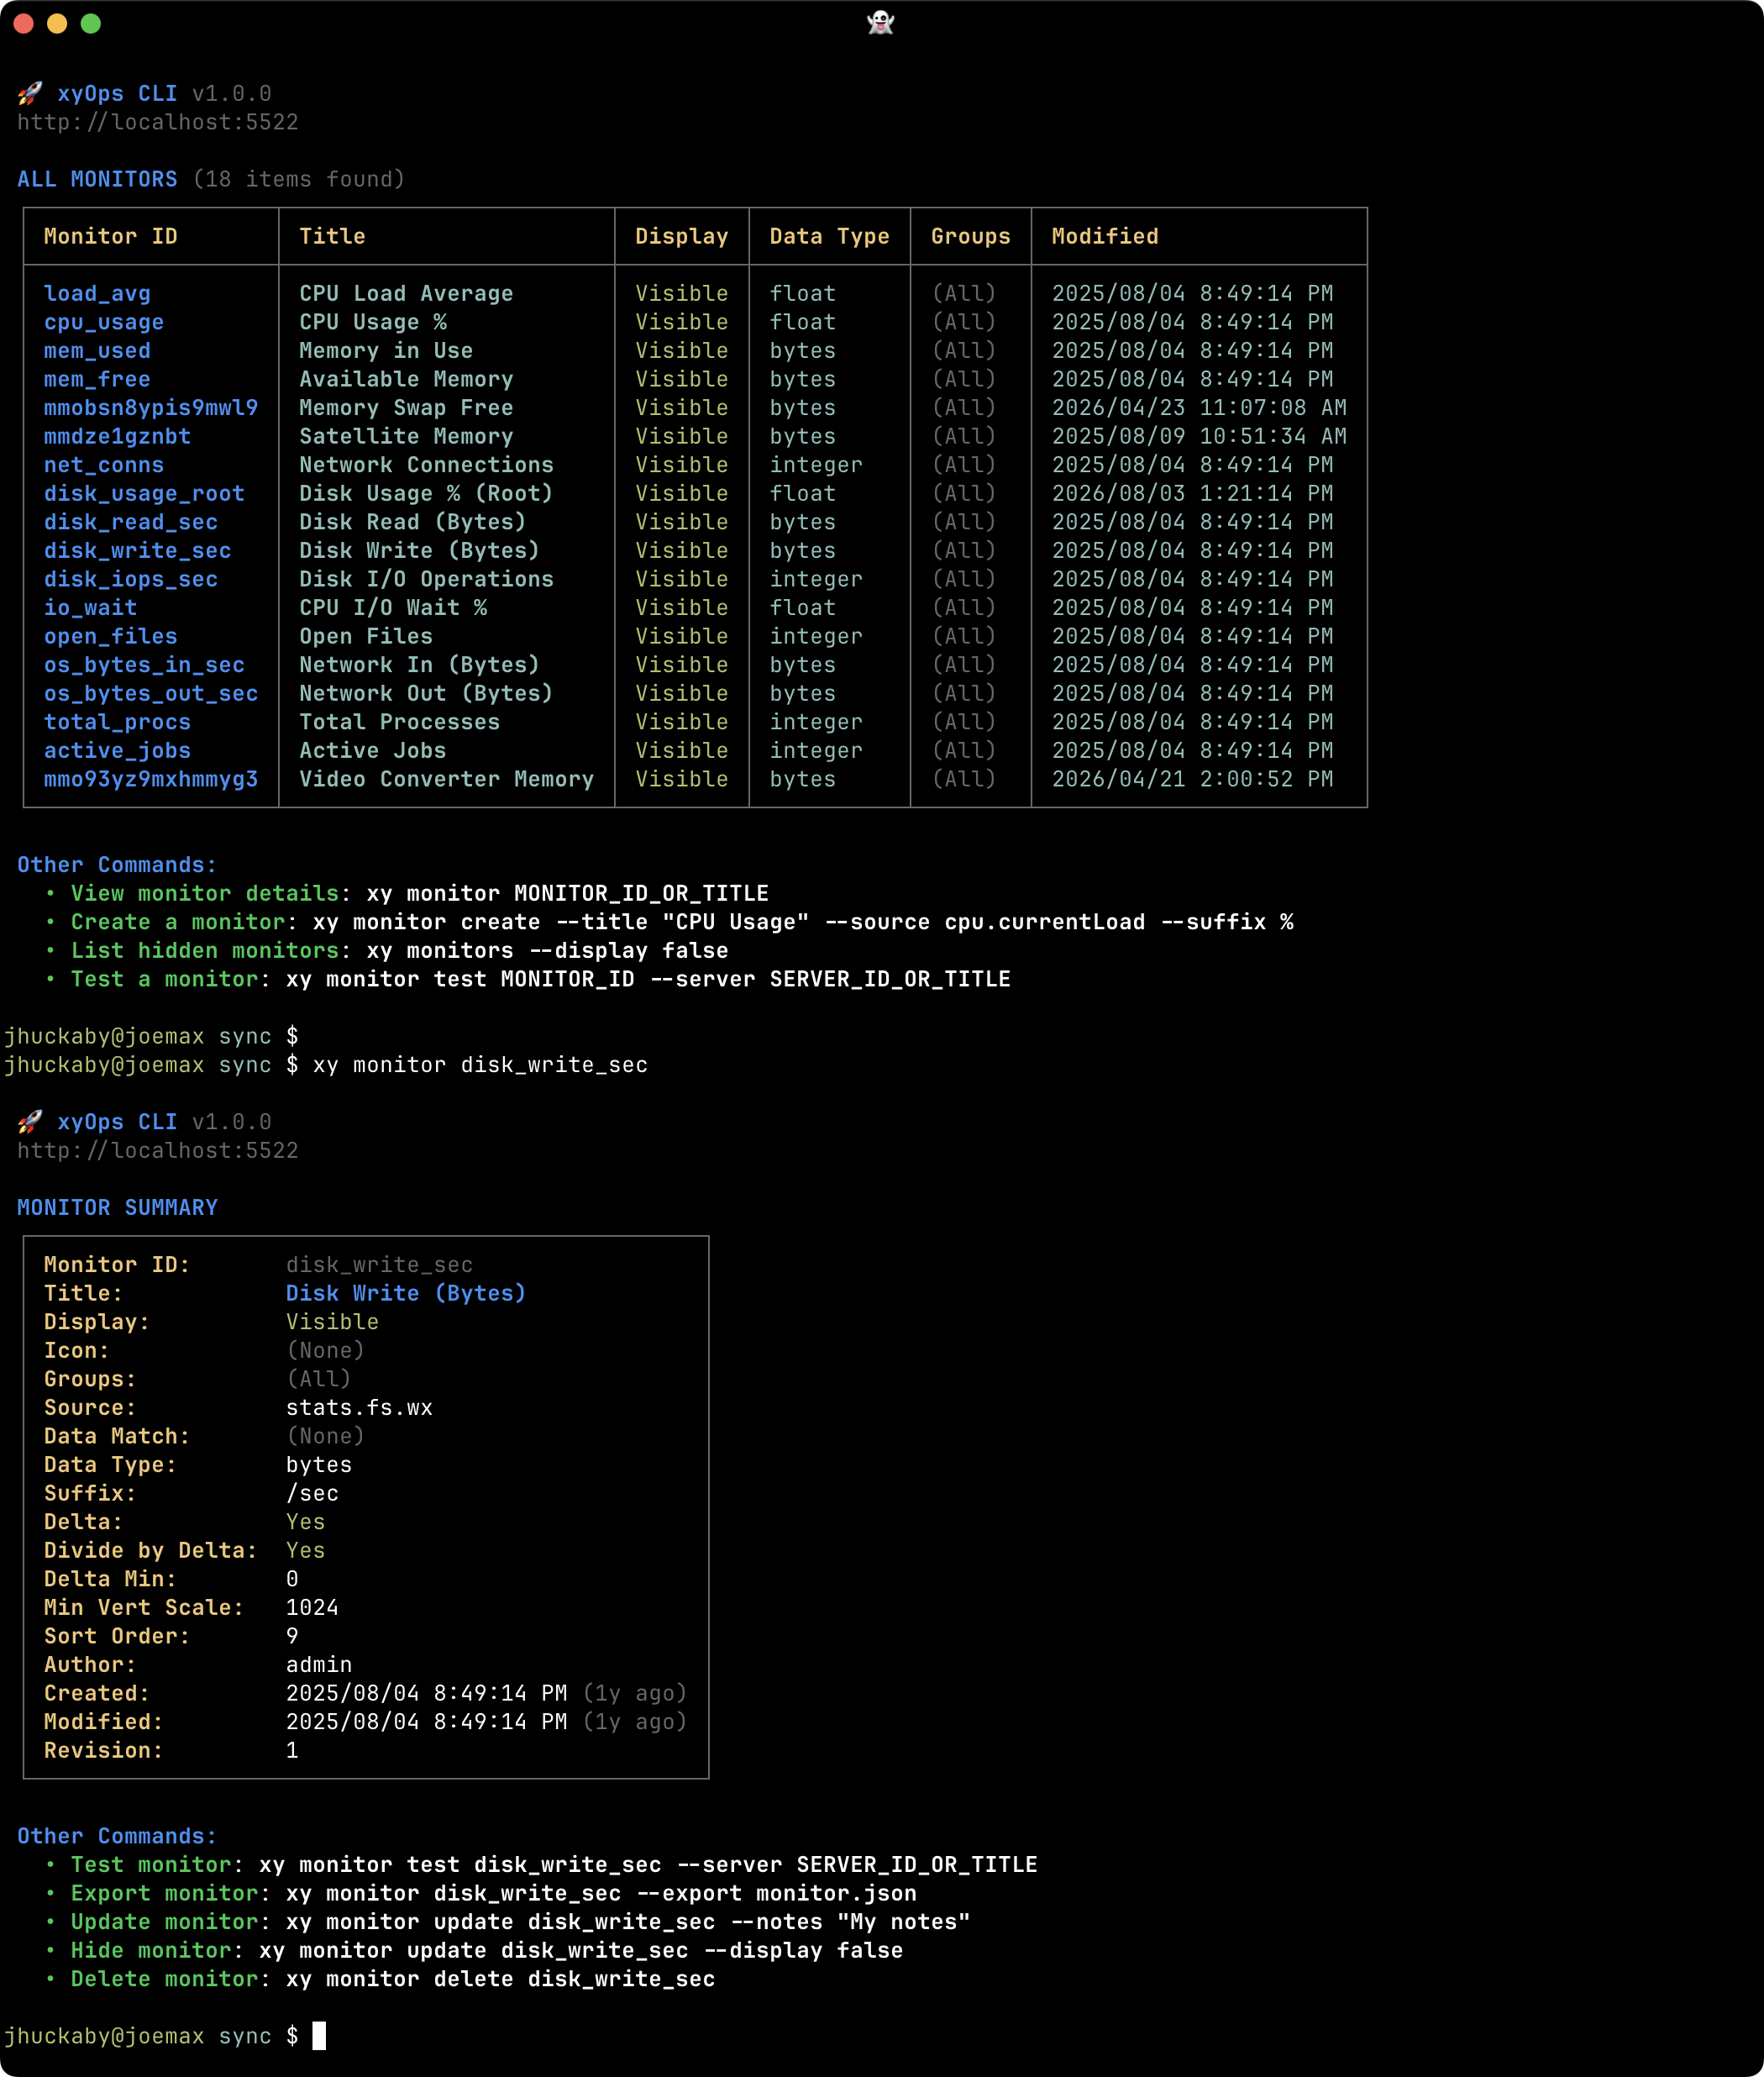
Browse metric definitions and inspect their source expressions, display settings, and scope.
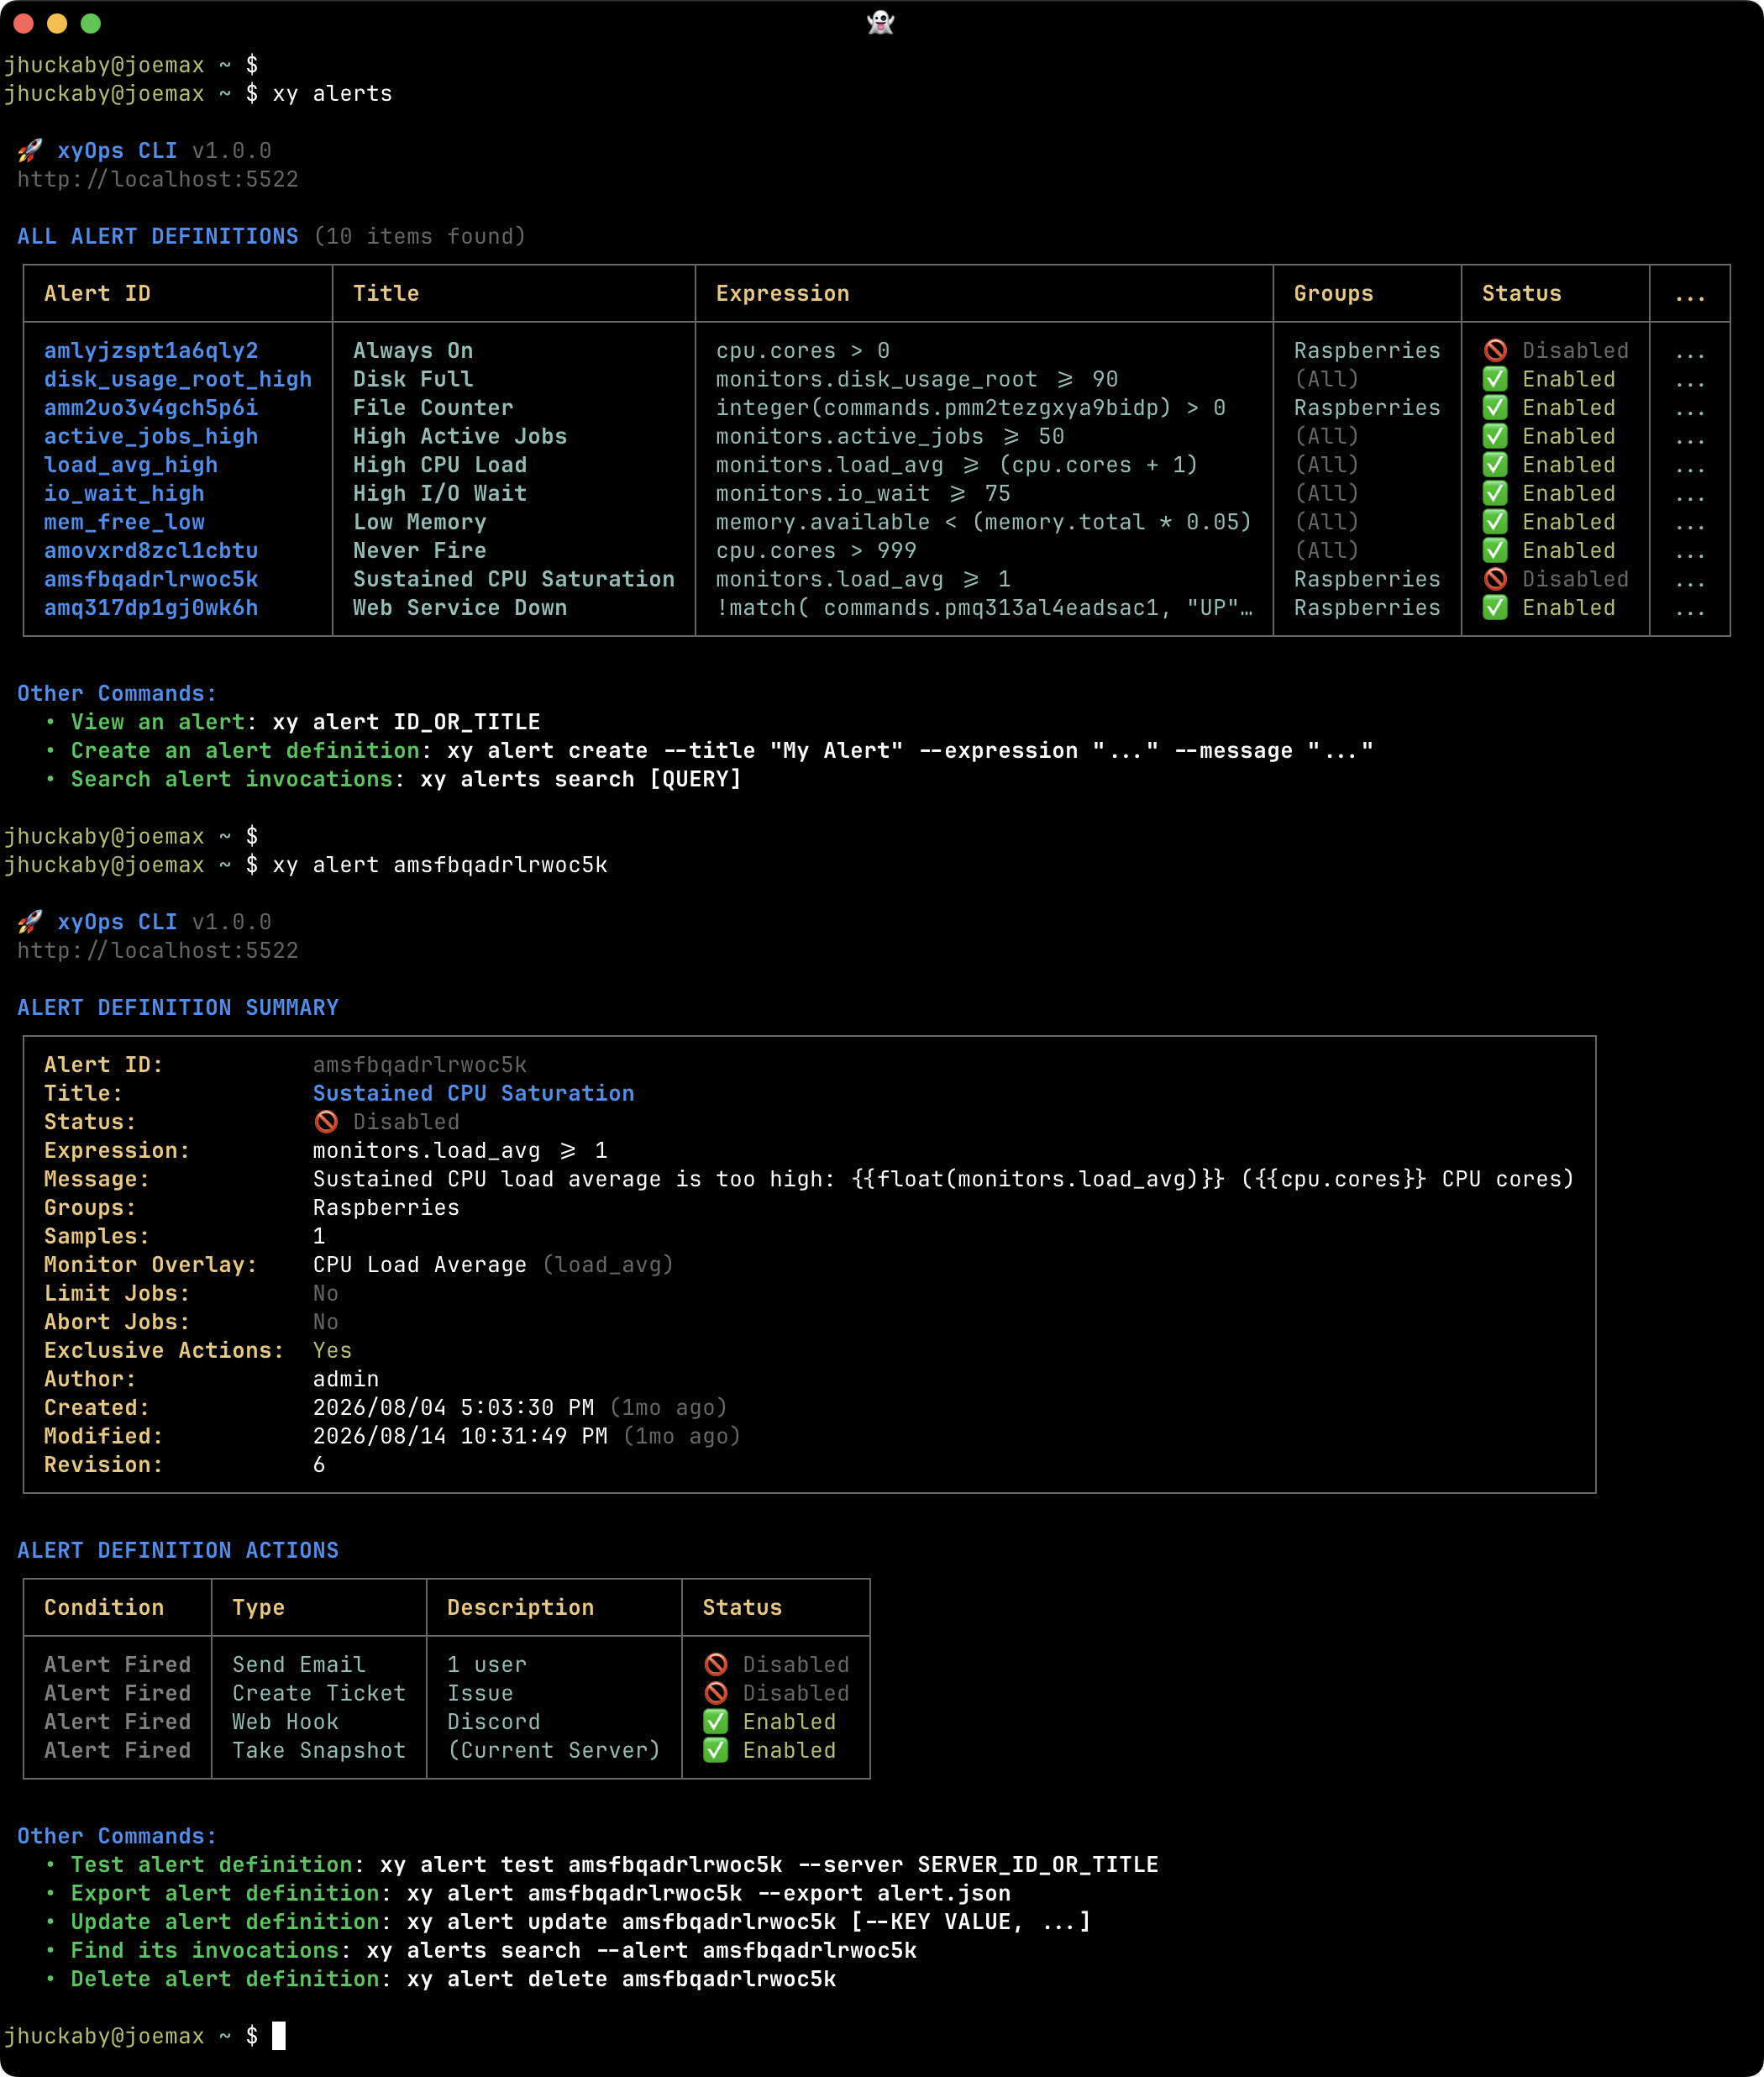
Review Alert expressions, messages, settings, and configured actions.
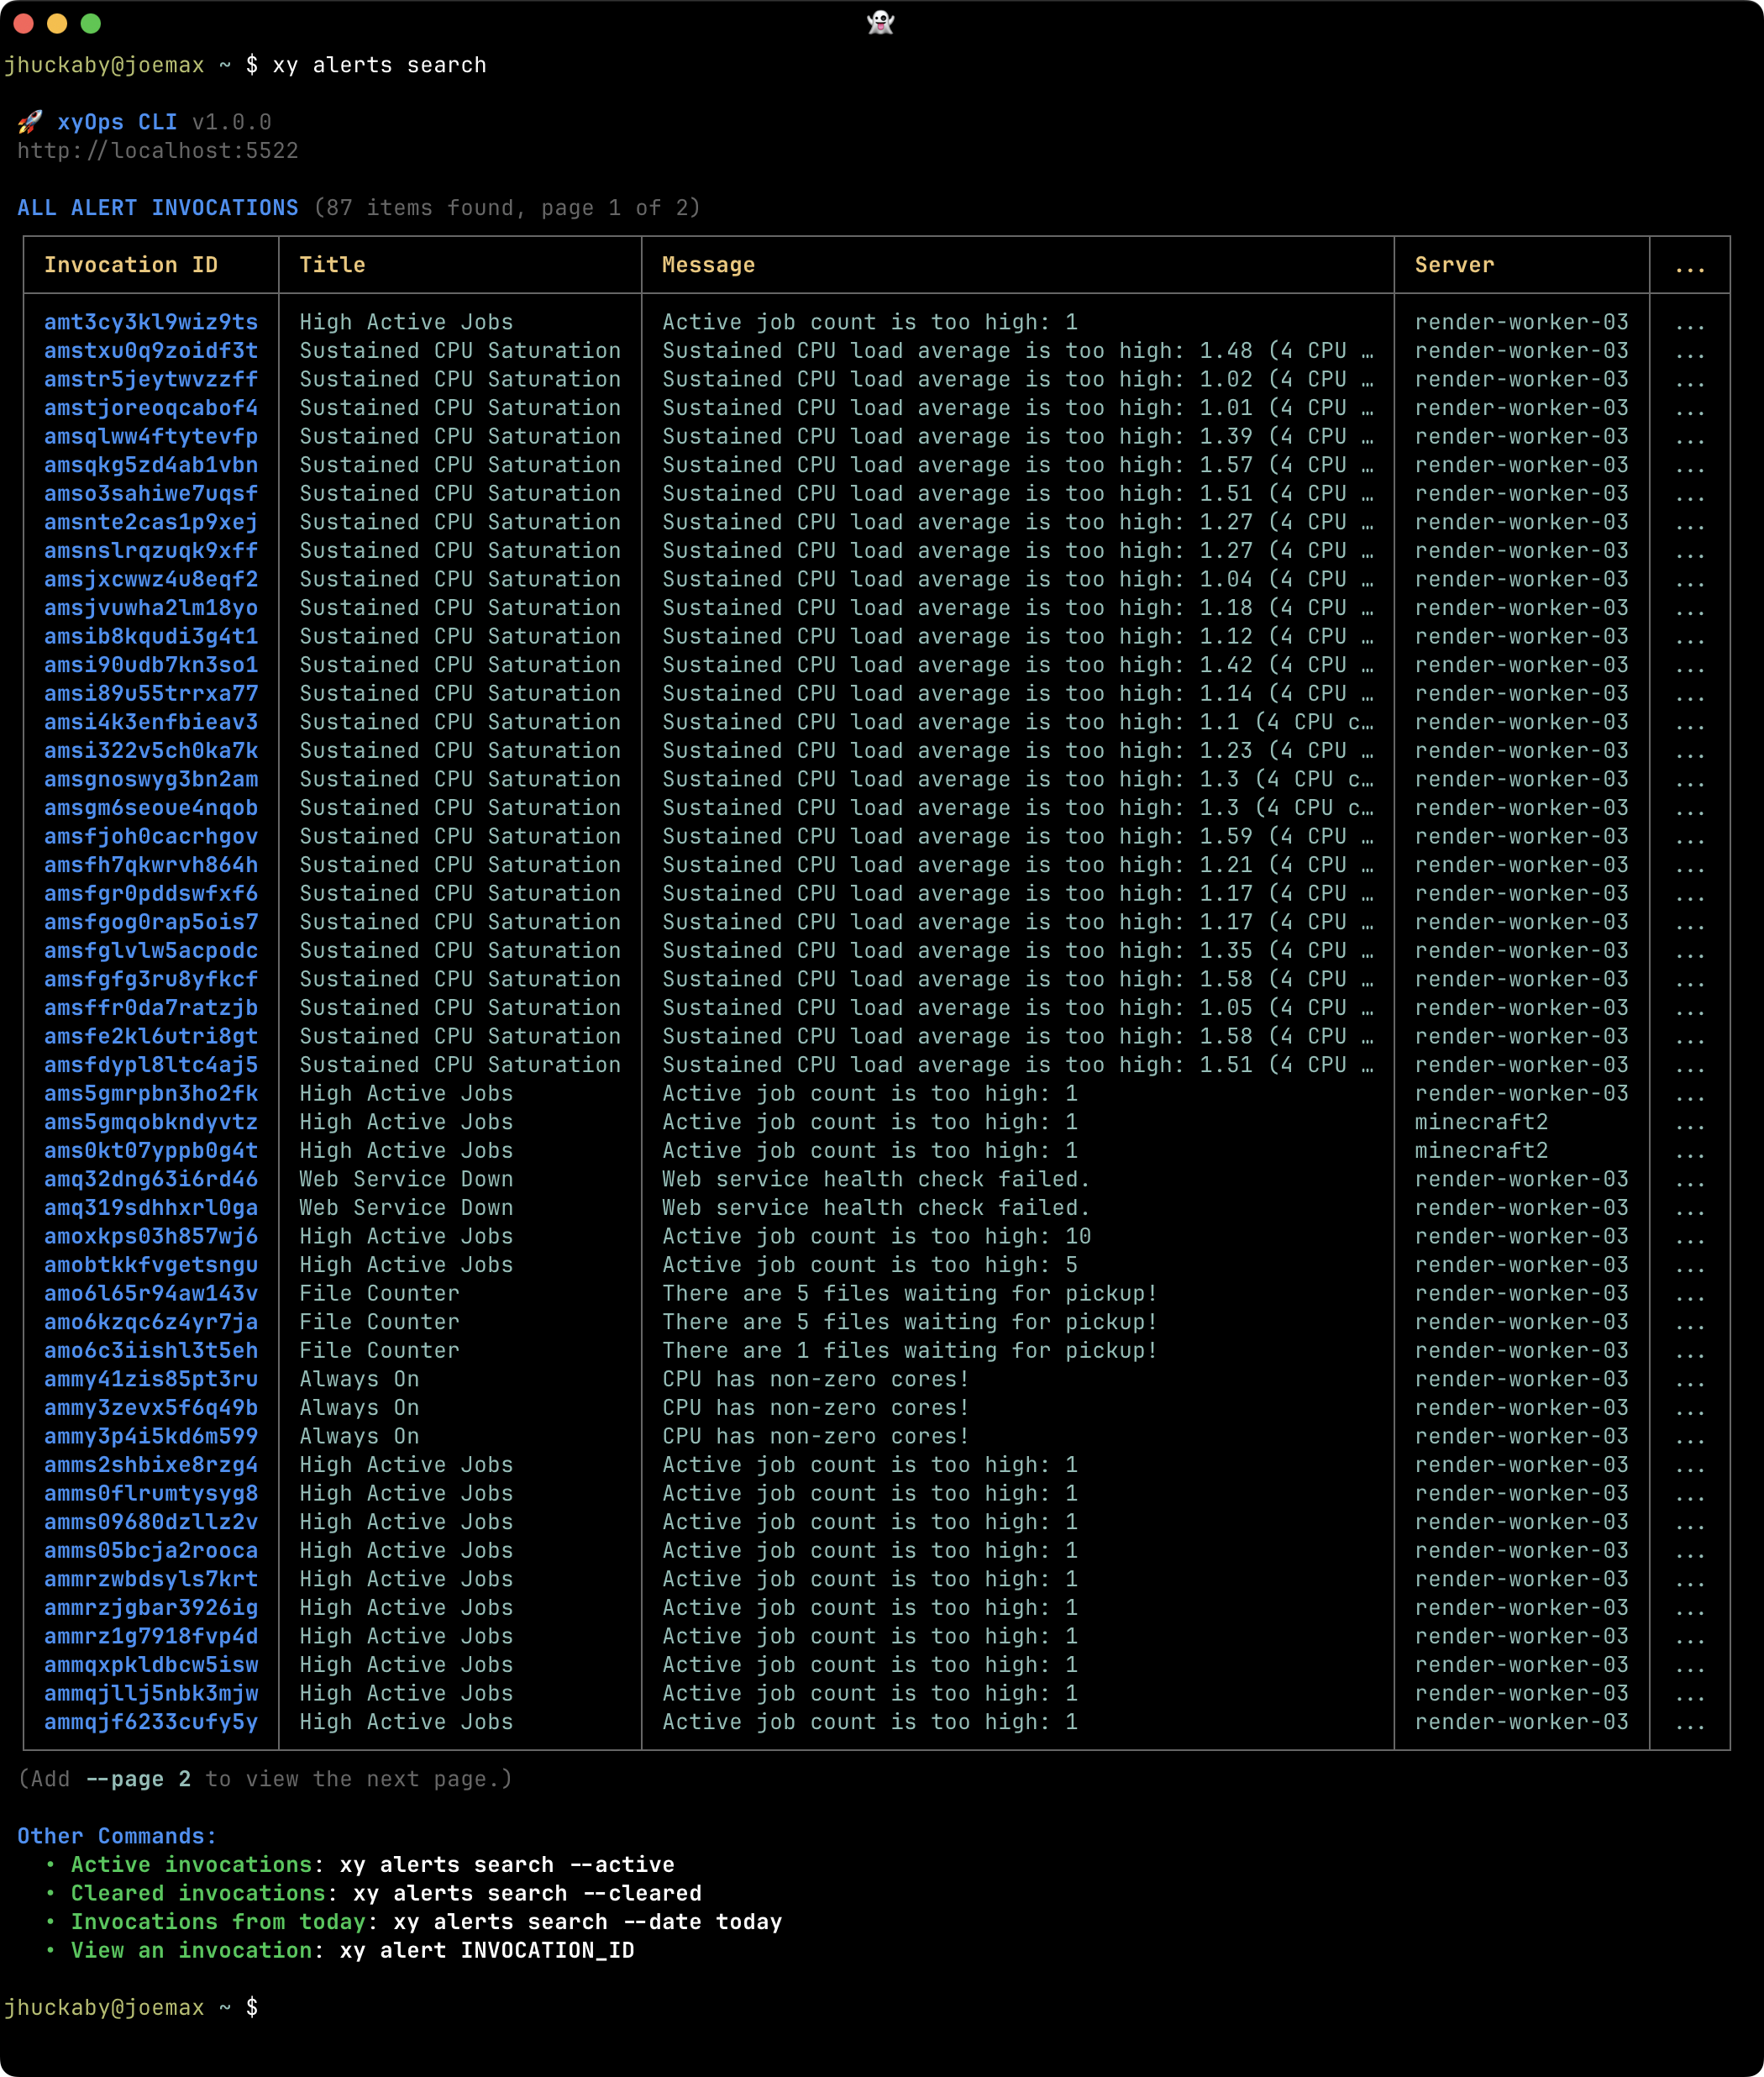
Search actual Alert occurrences to investigate affected servers, timing, and status.
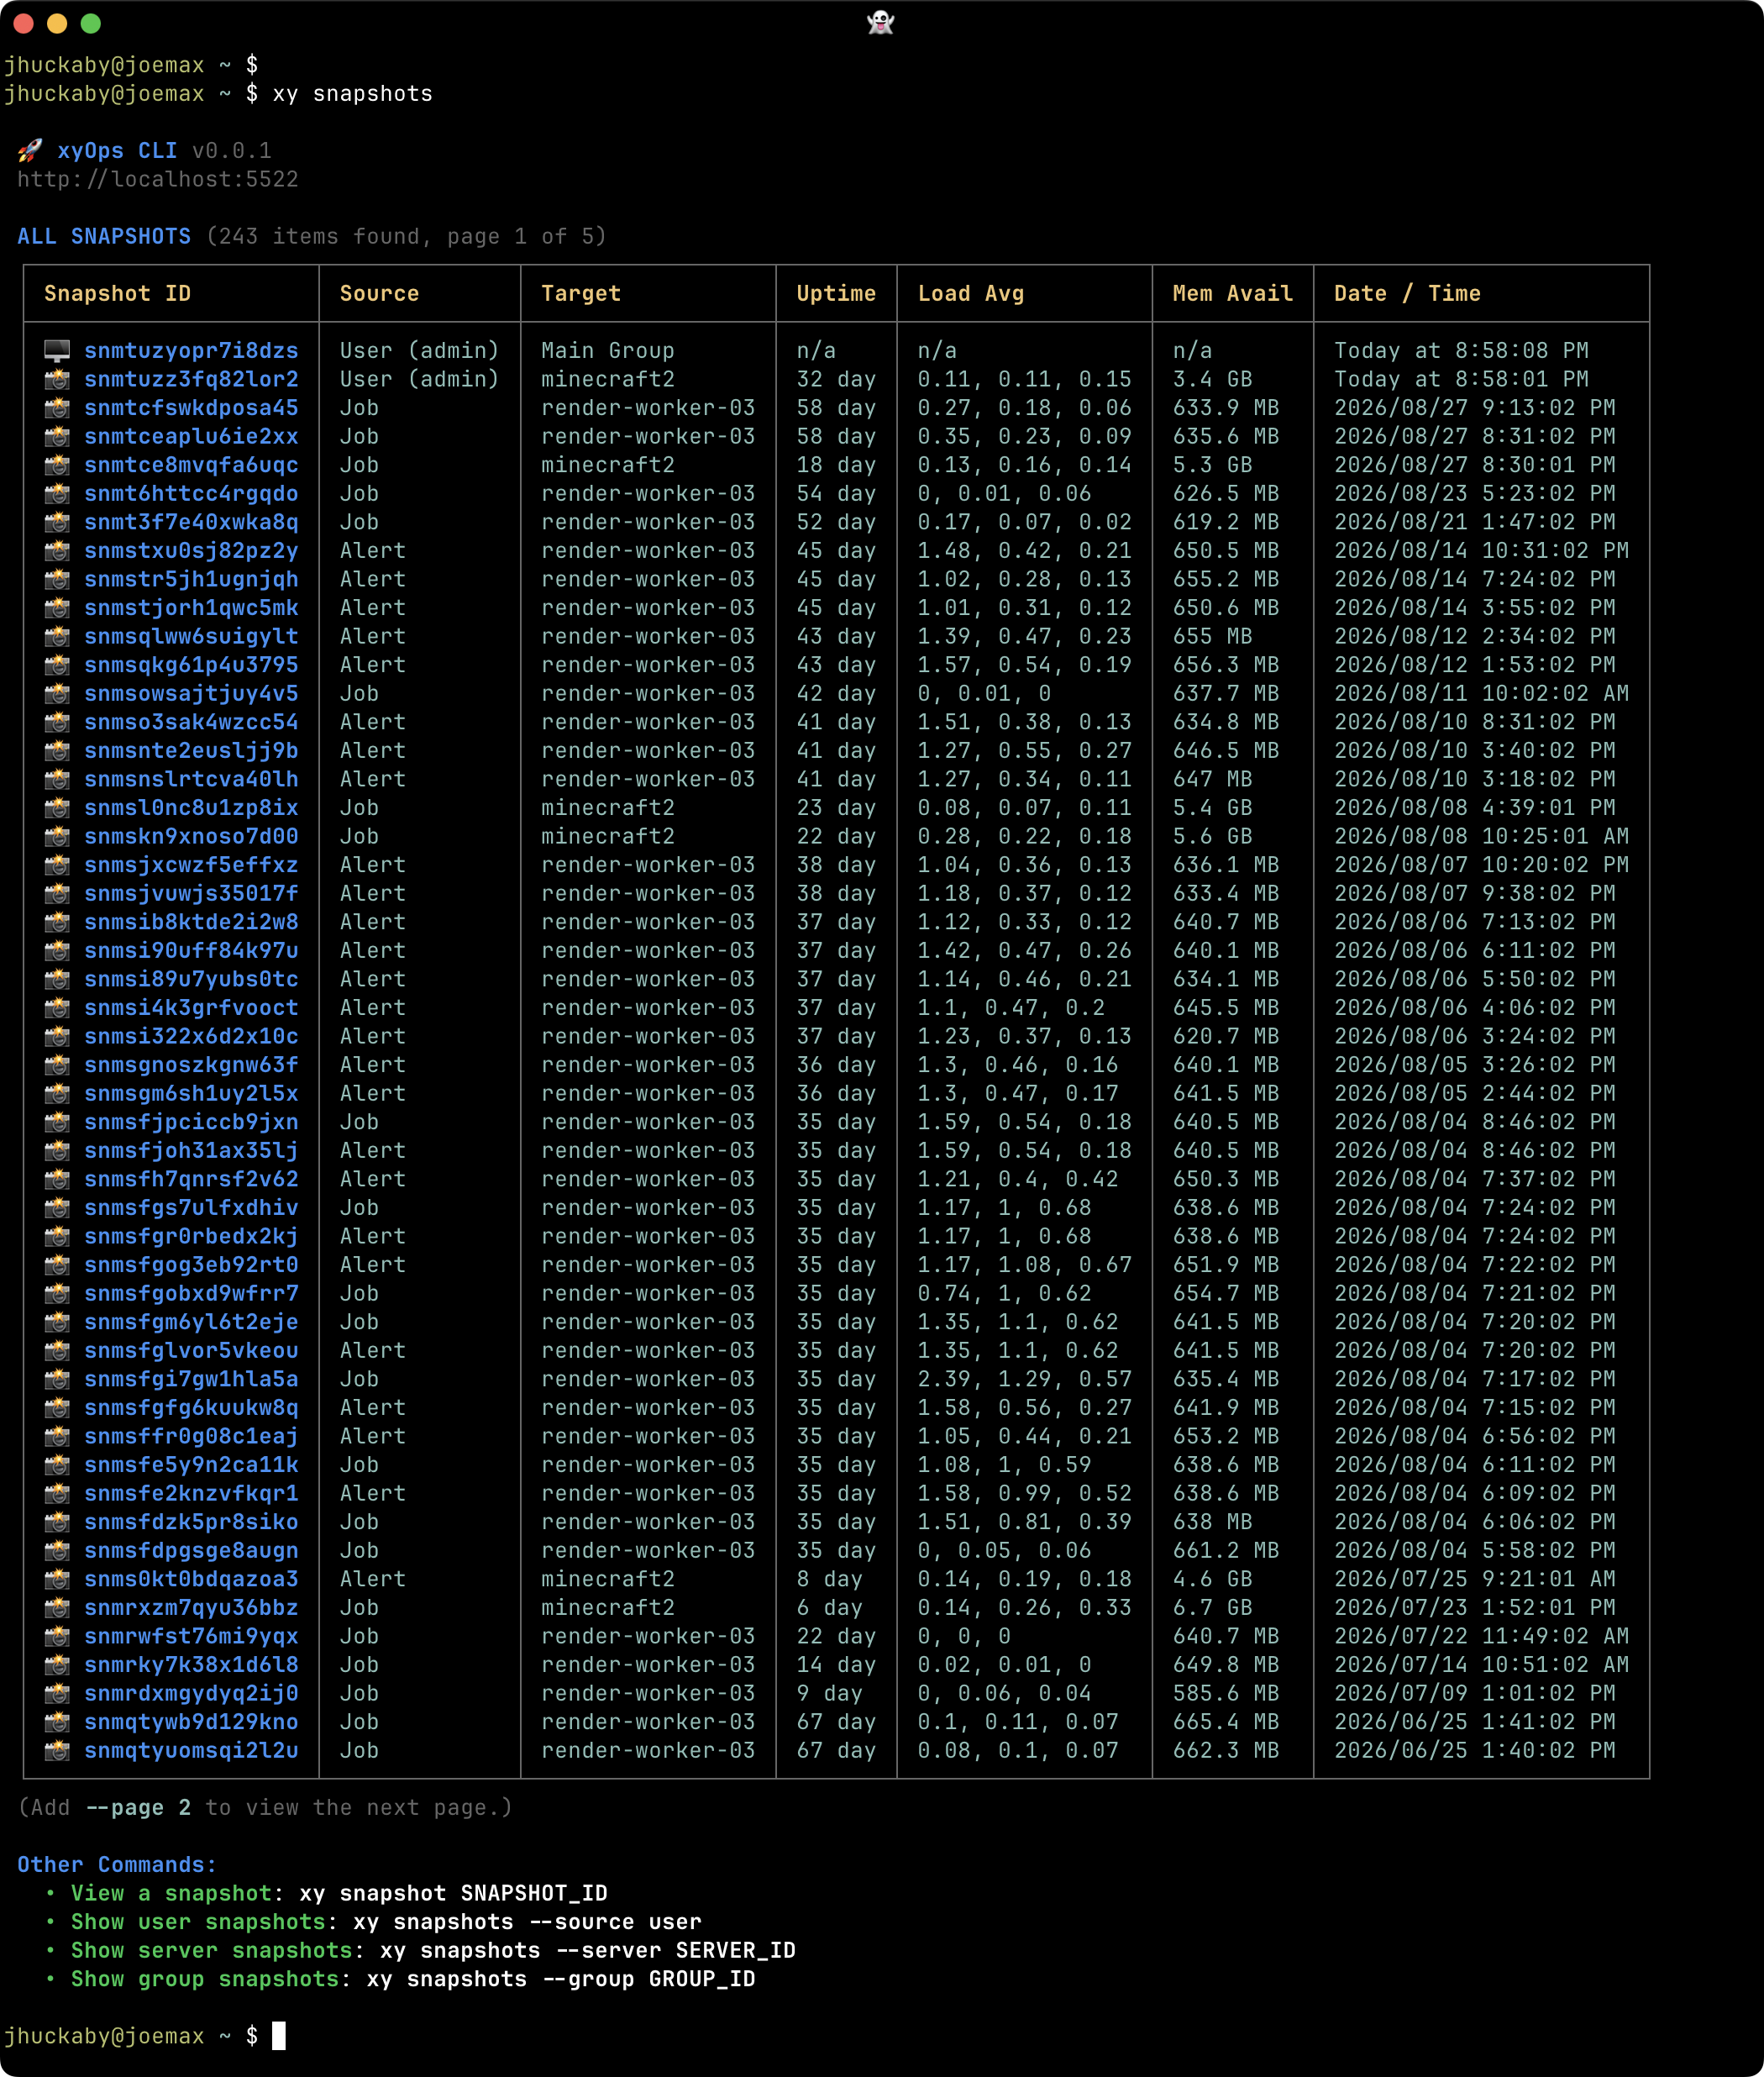
Browse point-in-time captures created by users, watches, jobs, and Alerts.
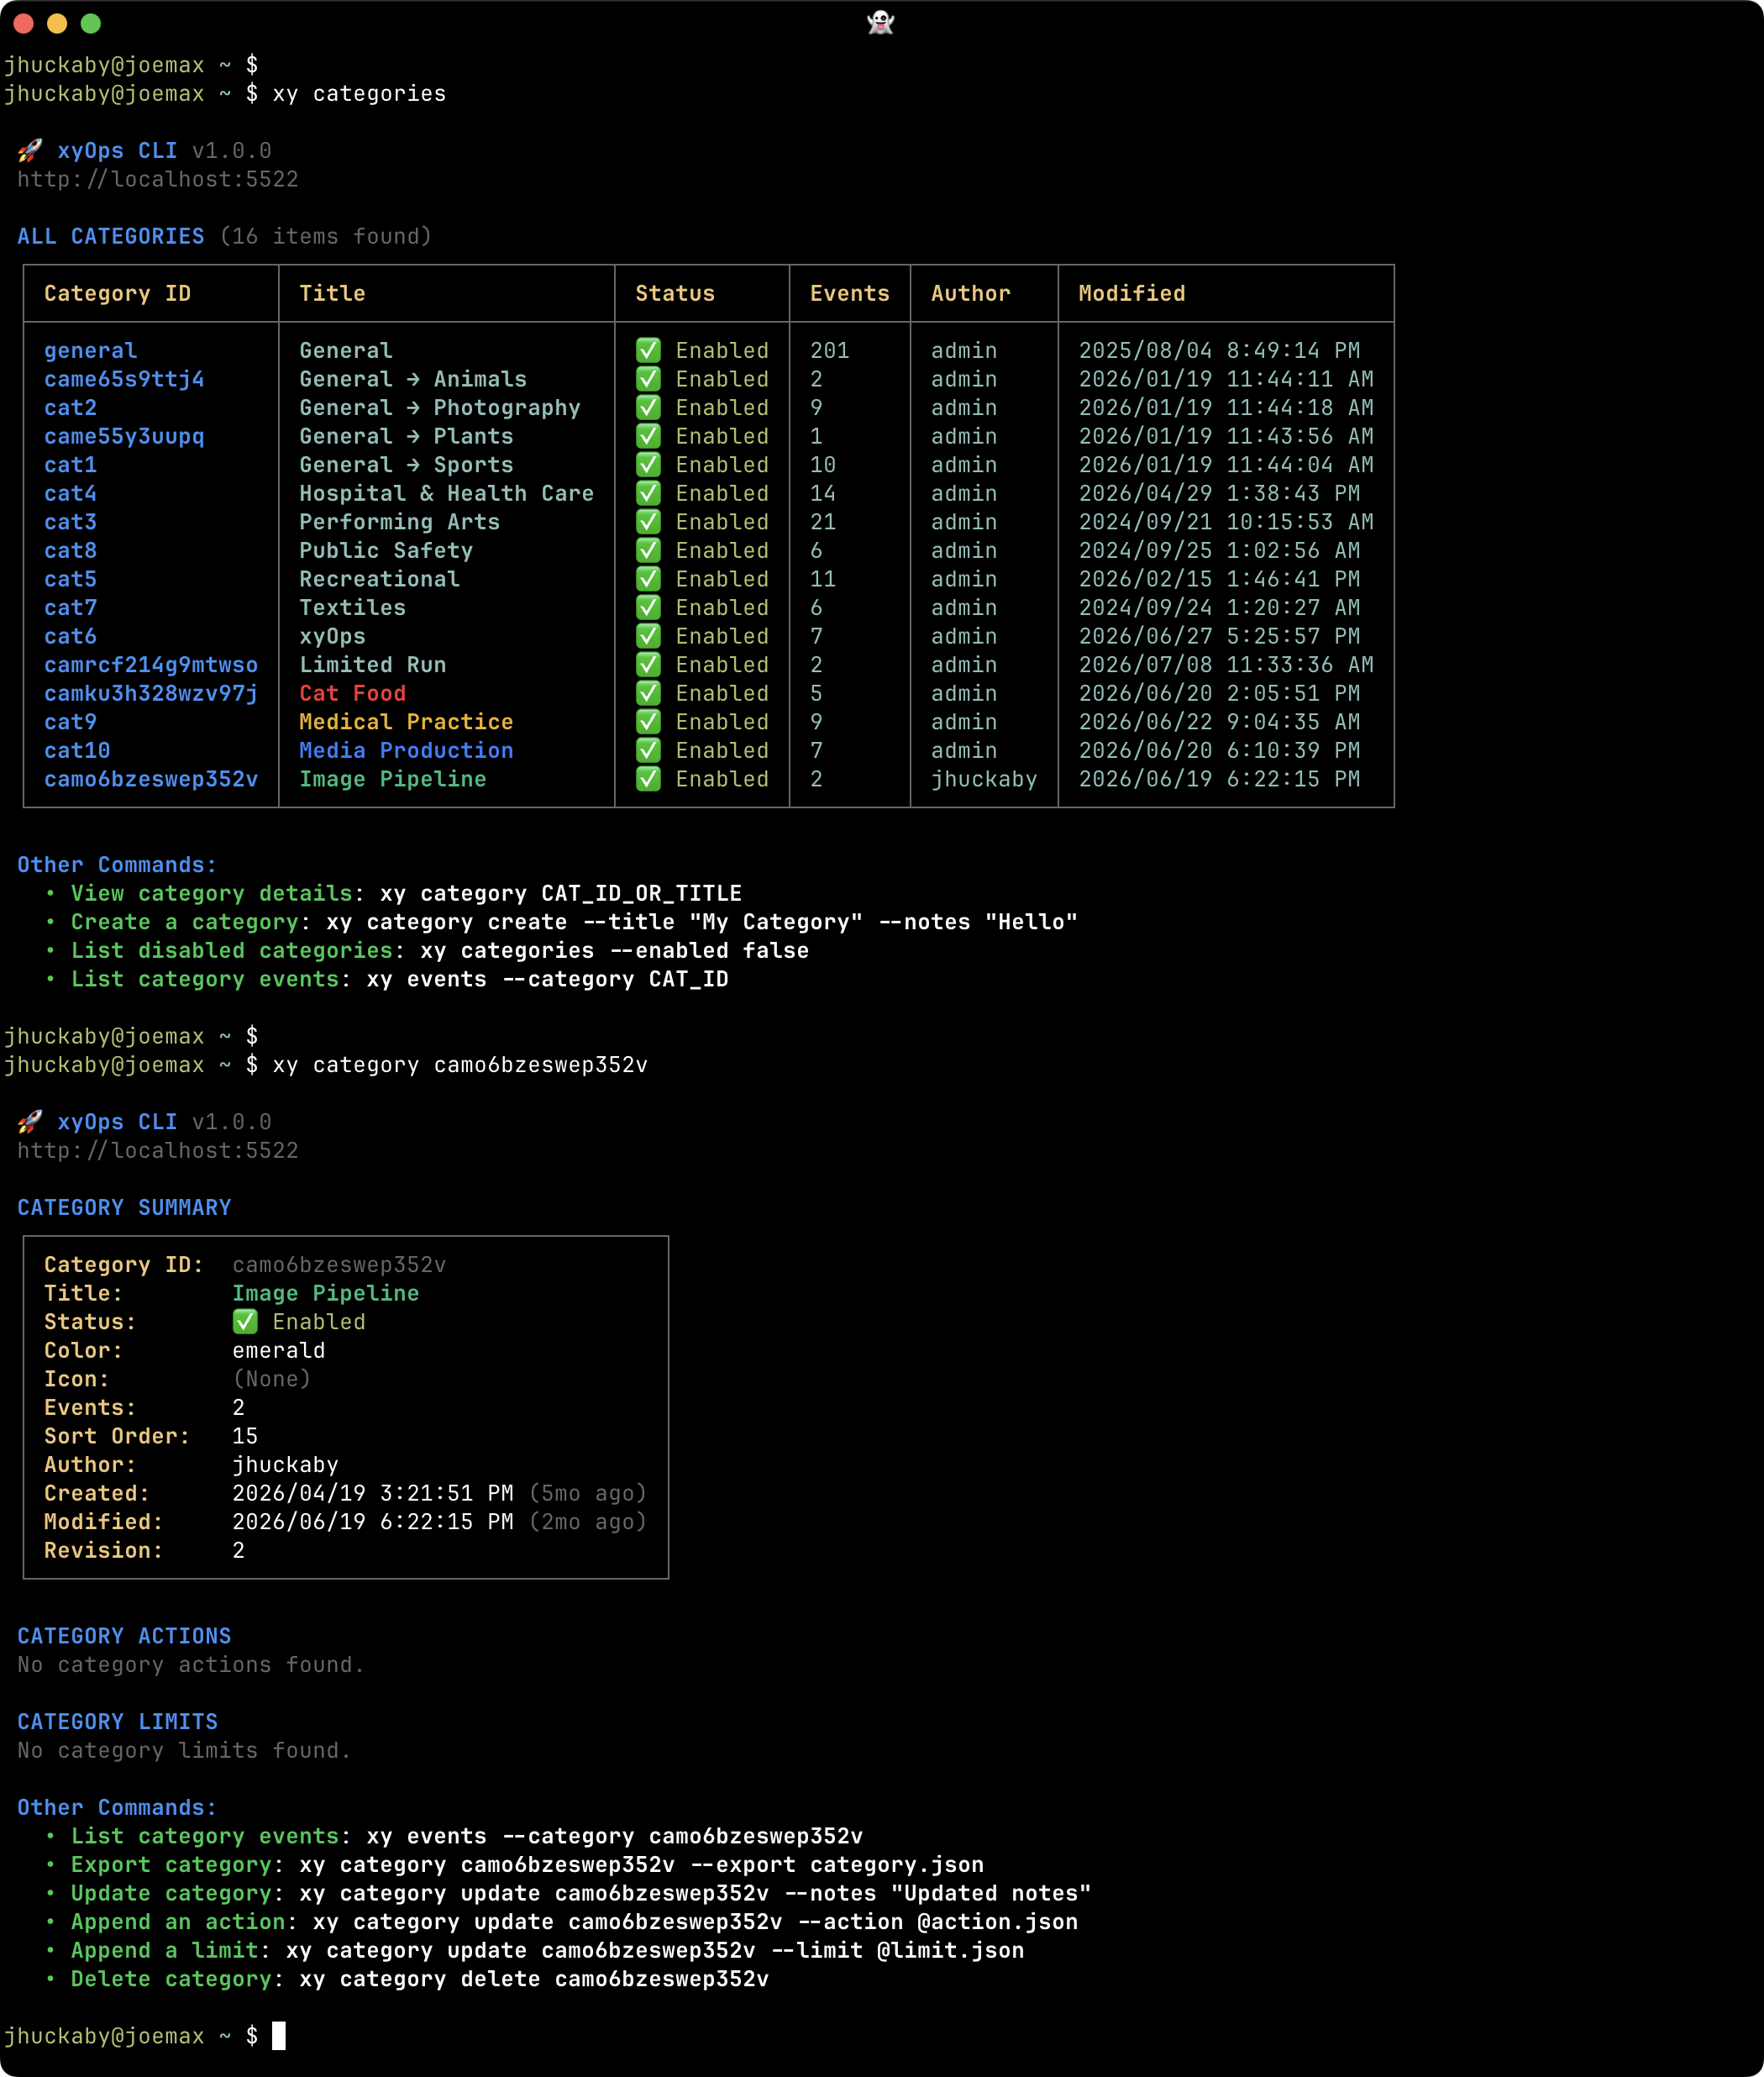
Organize Events and inspect the shared actions and limits applied through their Category.
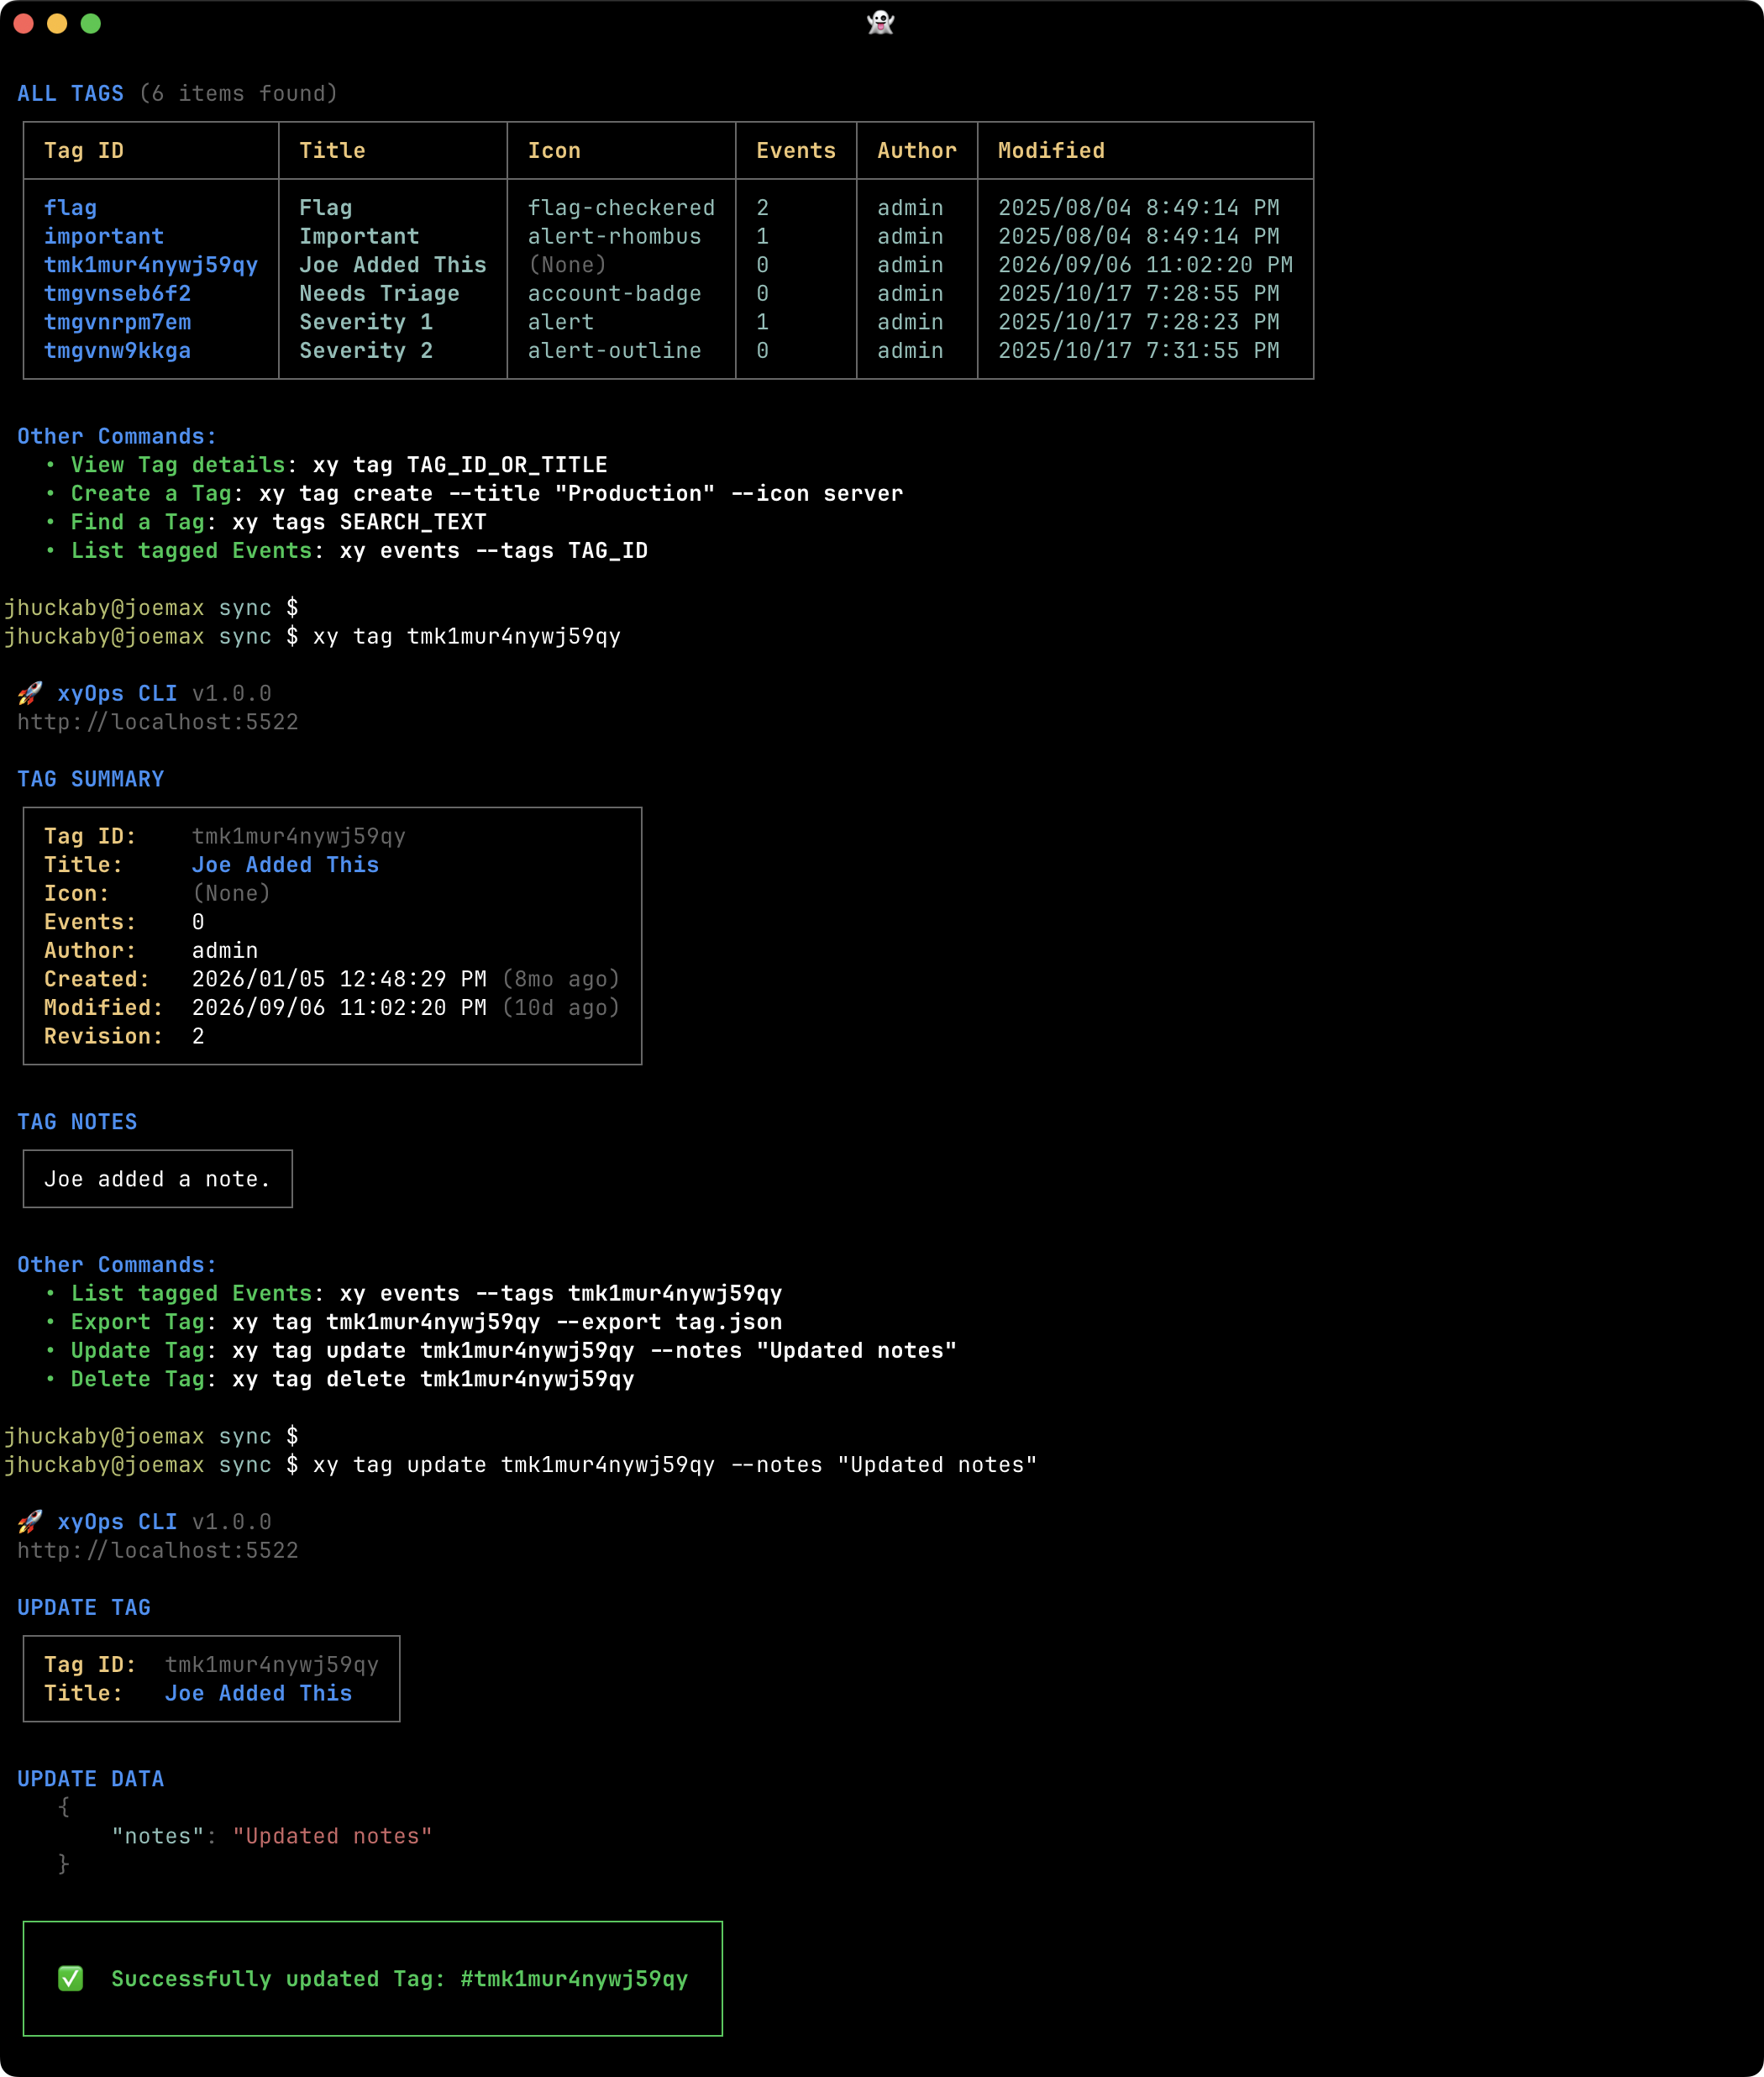
Manage reusable labels for finding related Events, jobs, and Tickets.
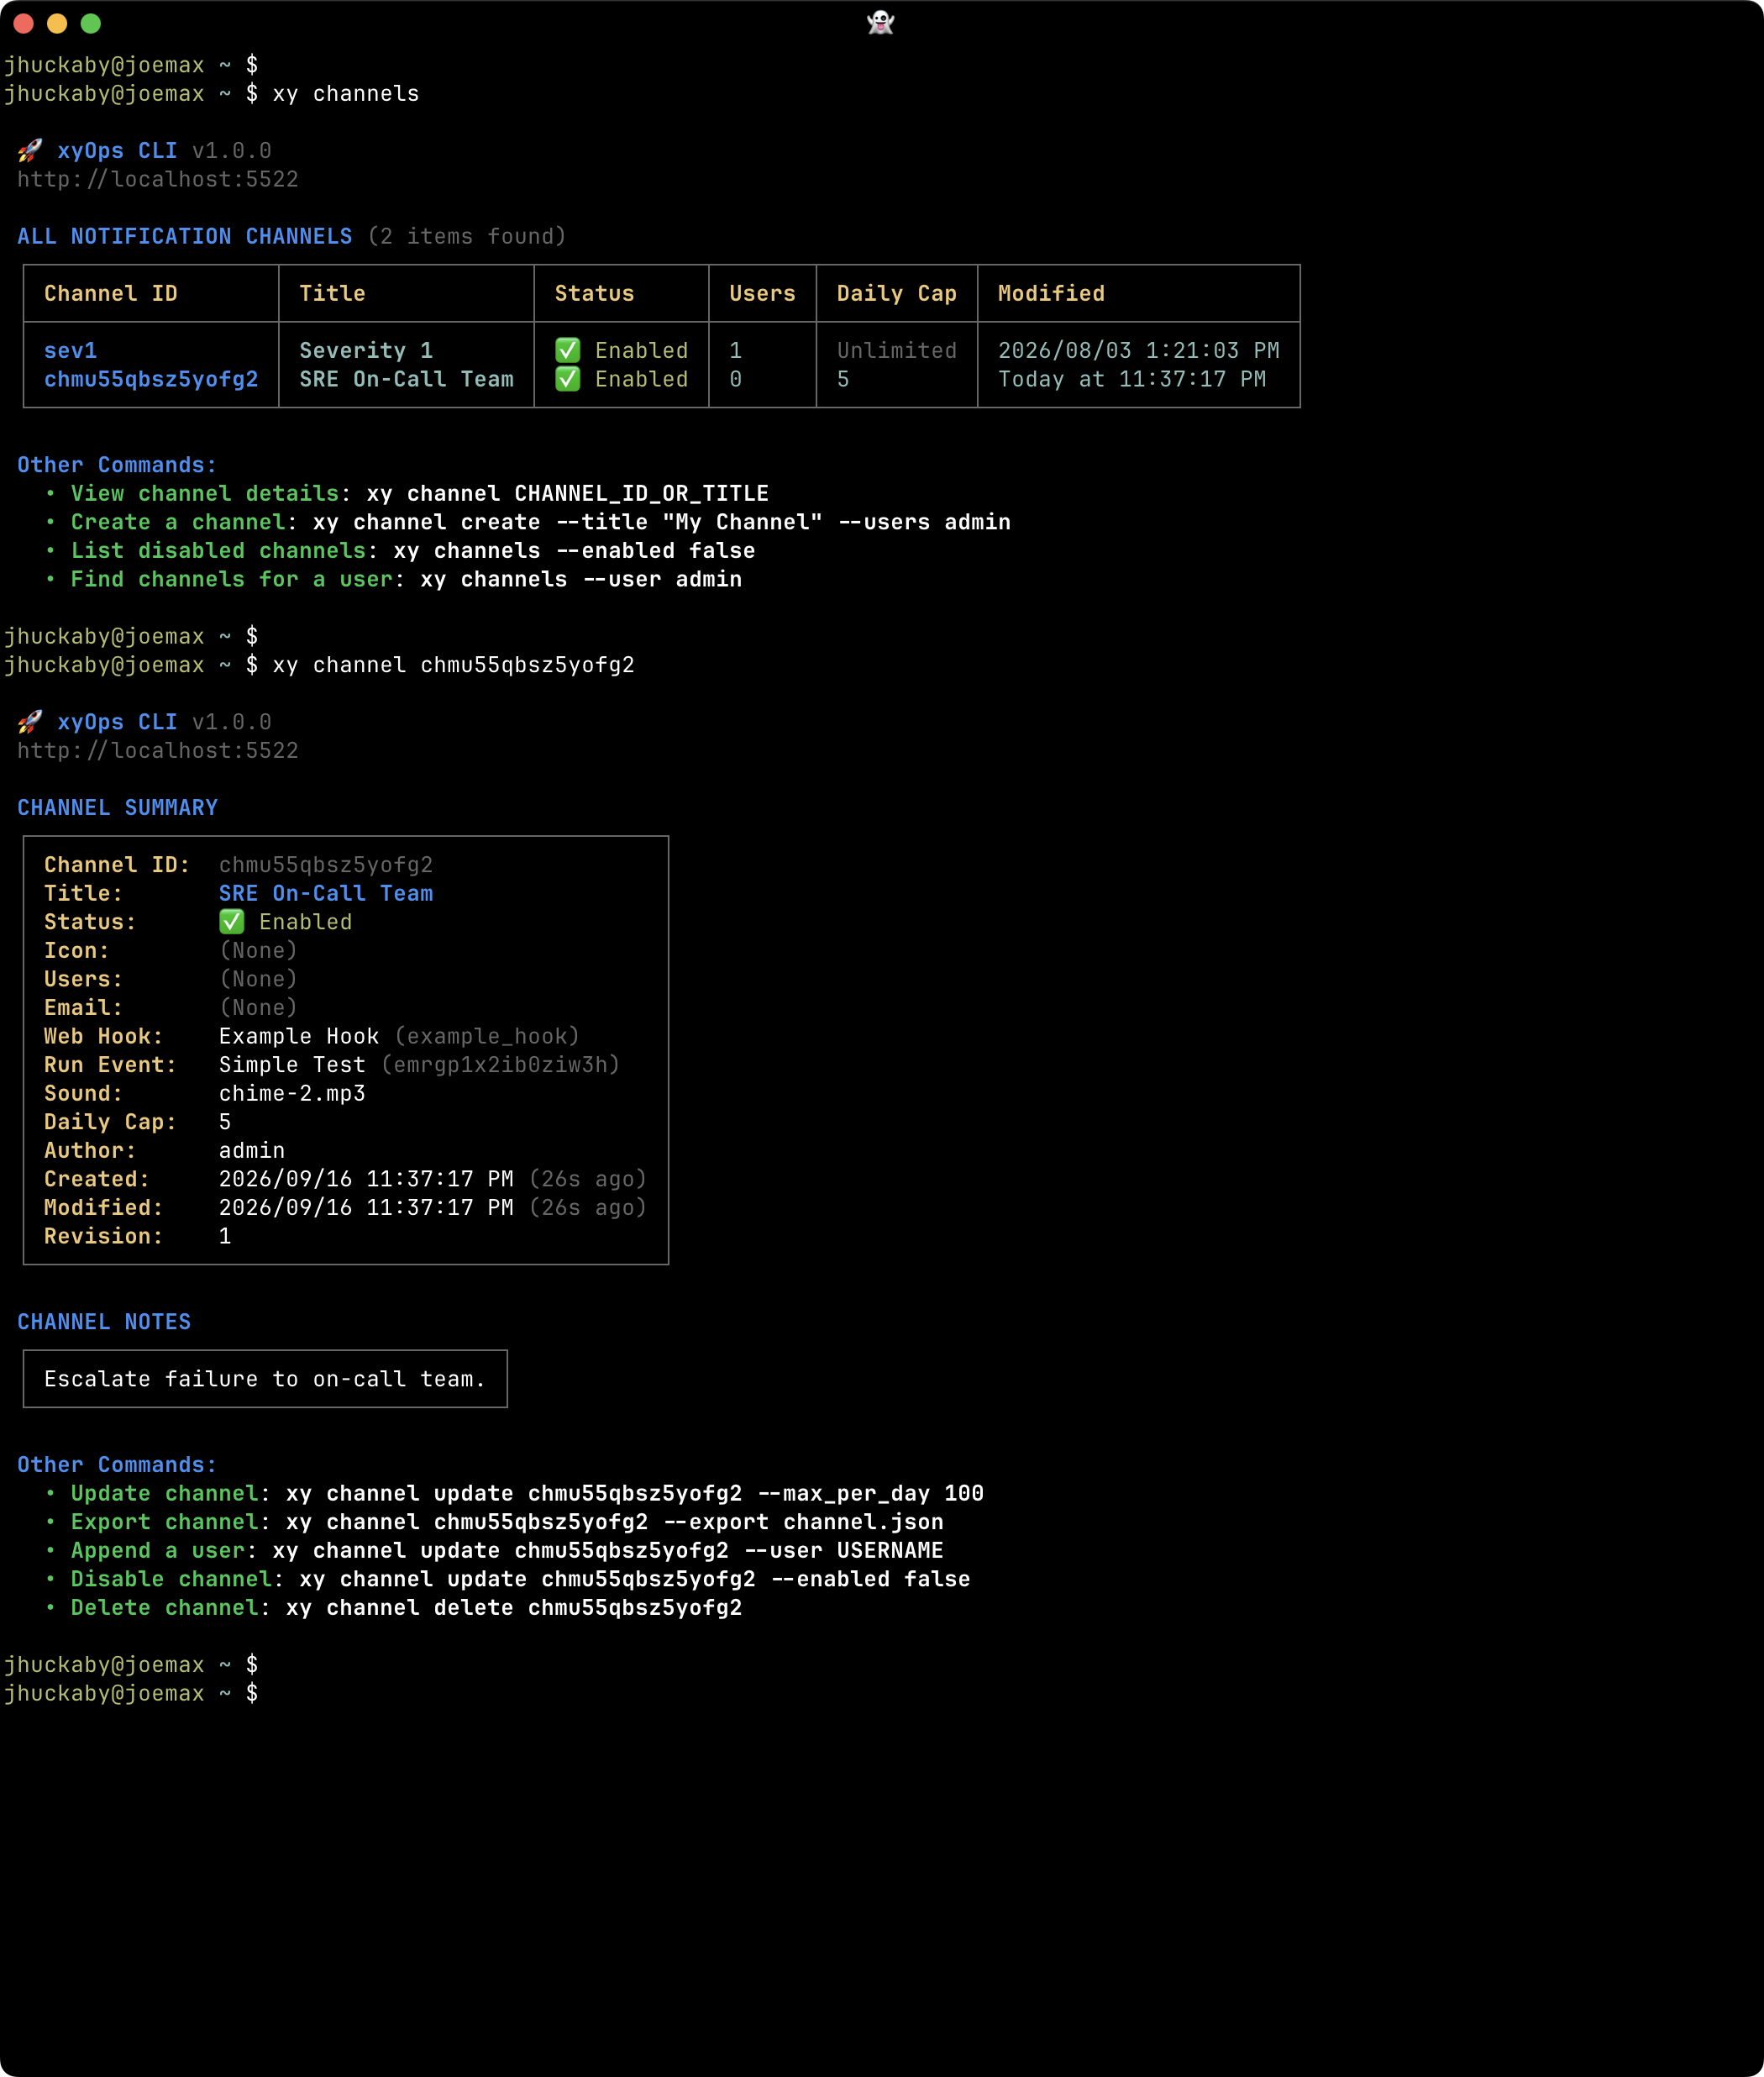
Inspect reusable recipients and follow-up actions for your automation's notifications.
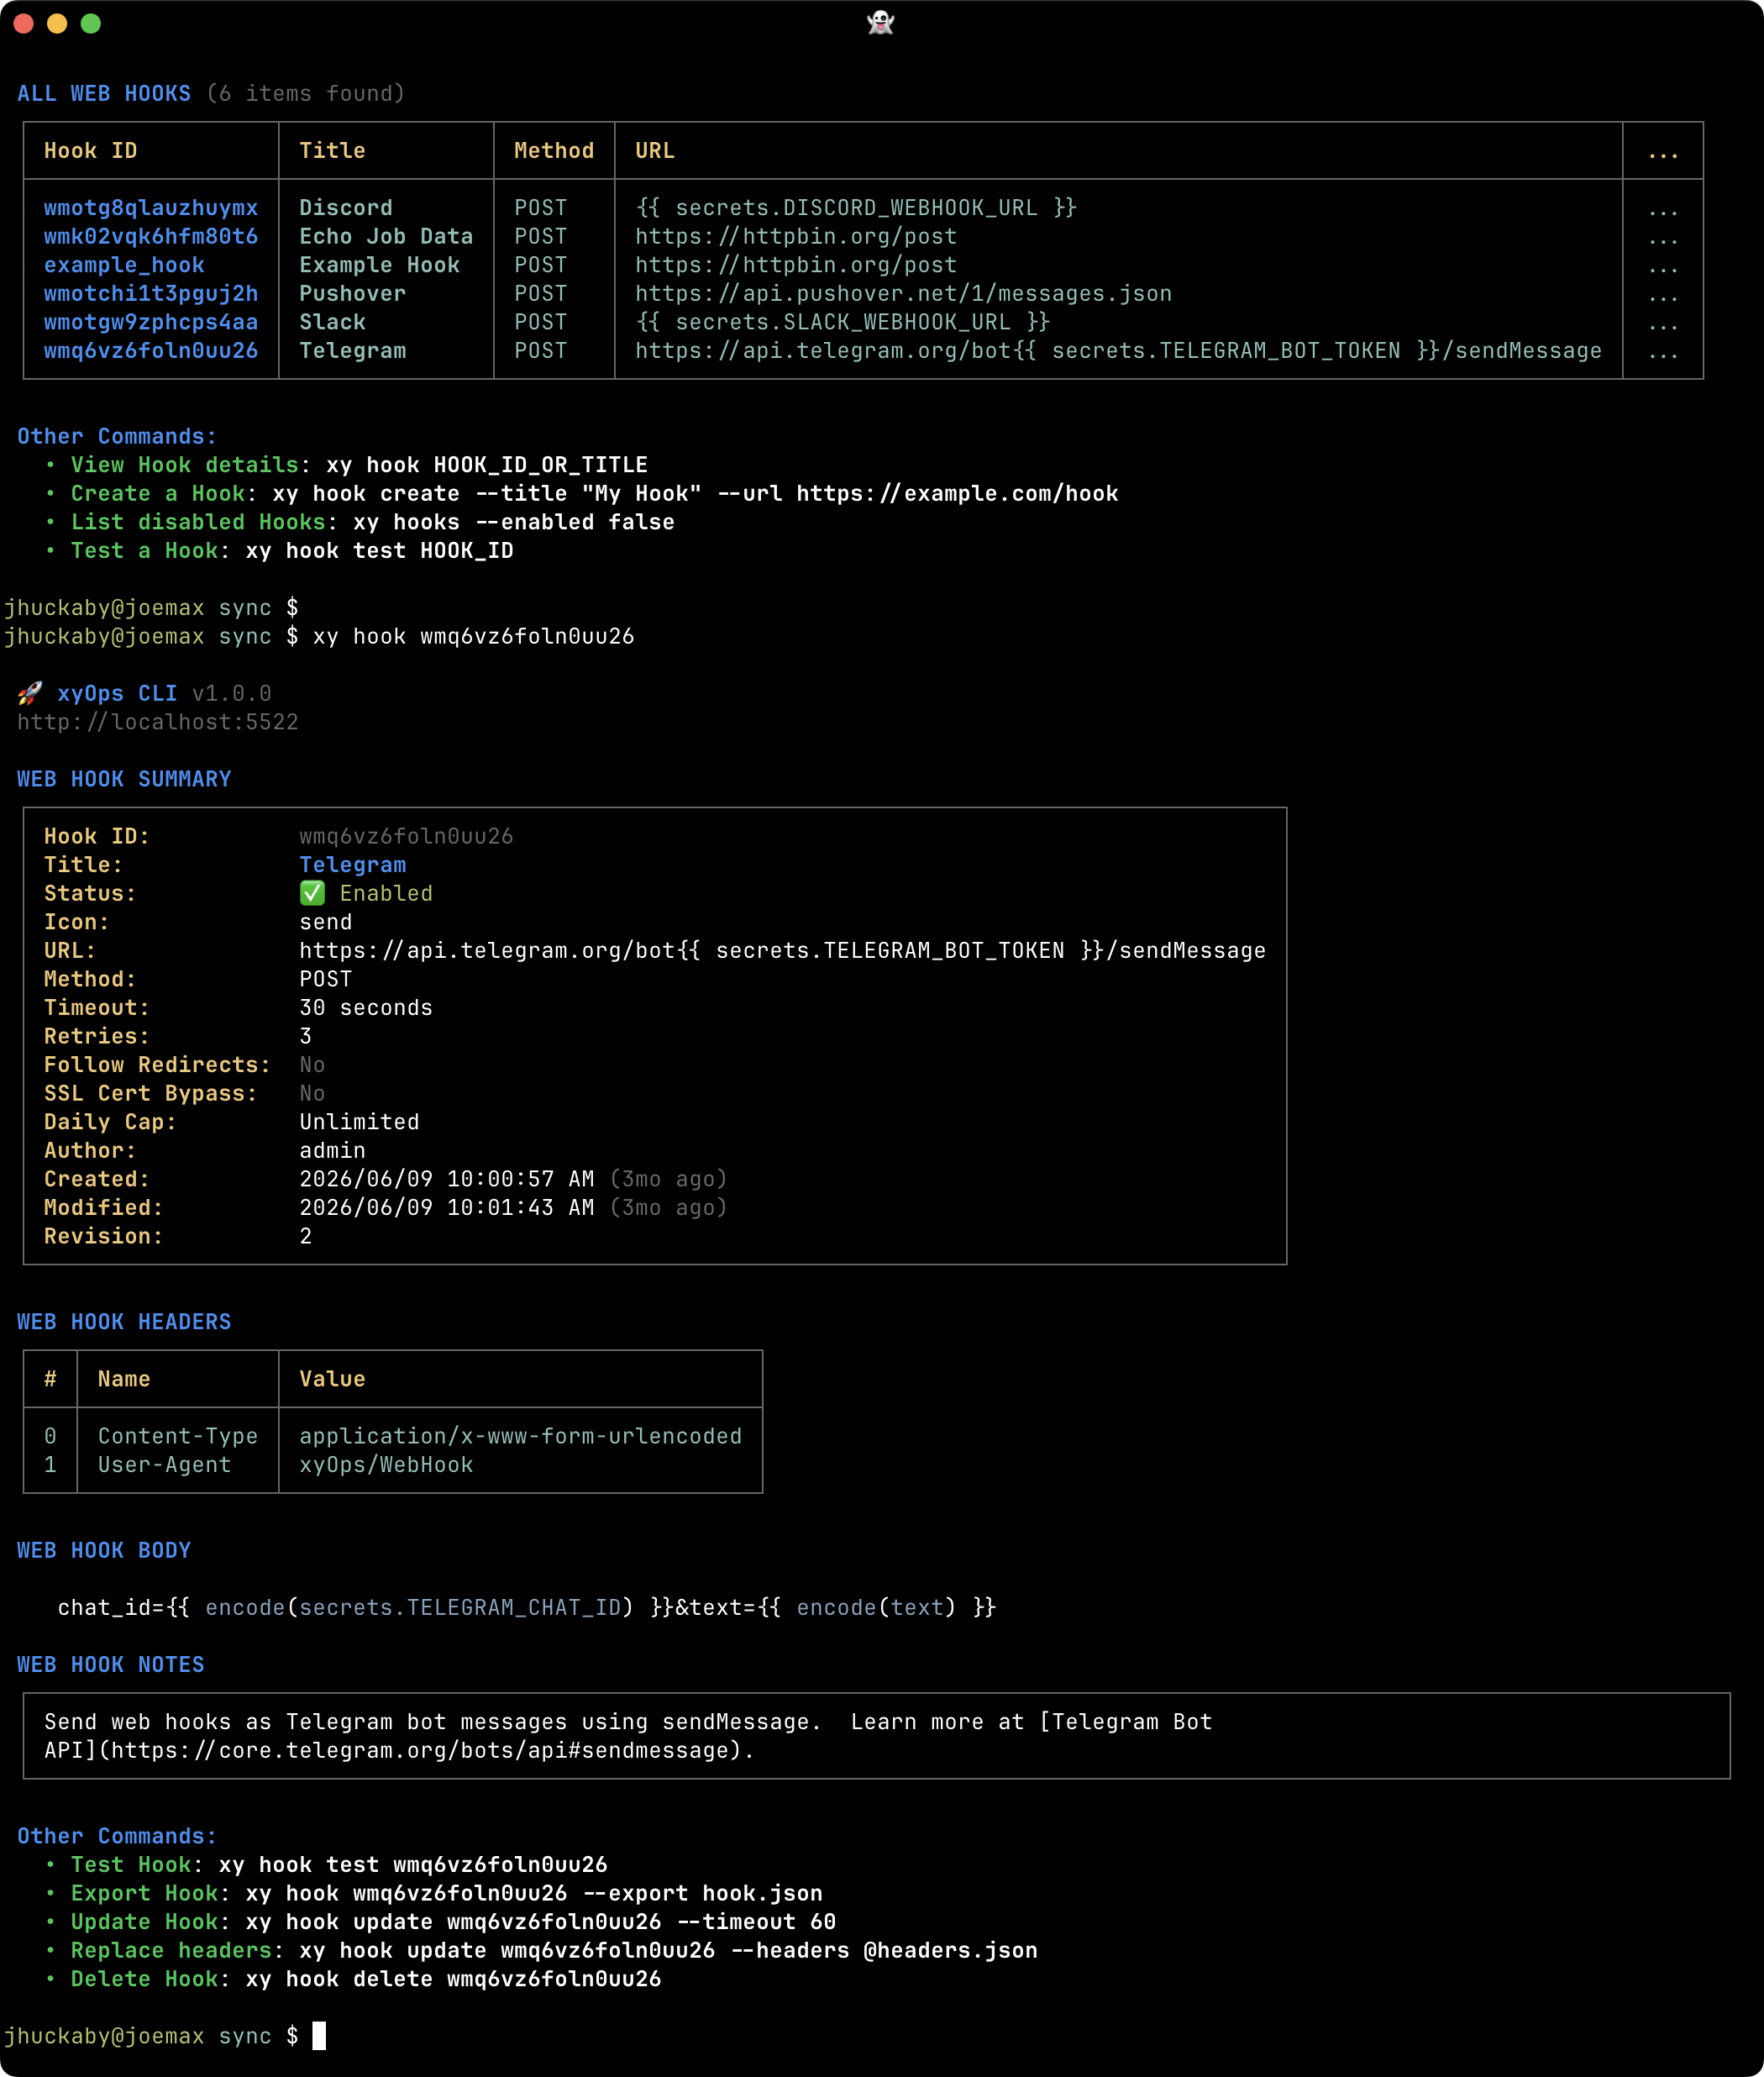
Review outbound HTTP integrations, including their URLs, headers, and request bodies.
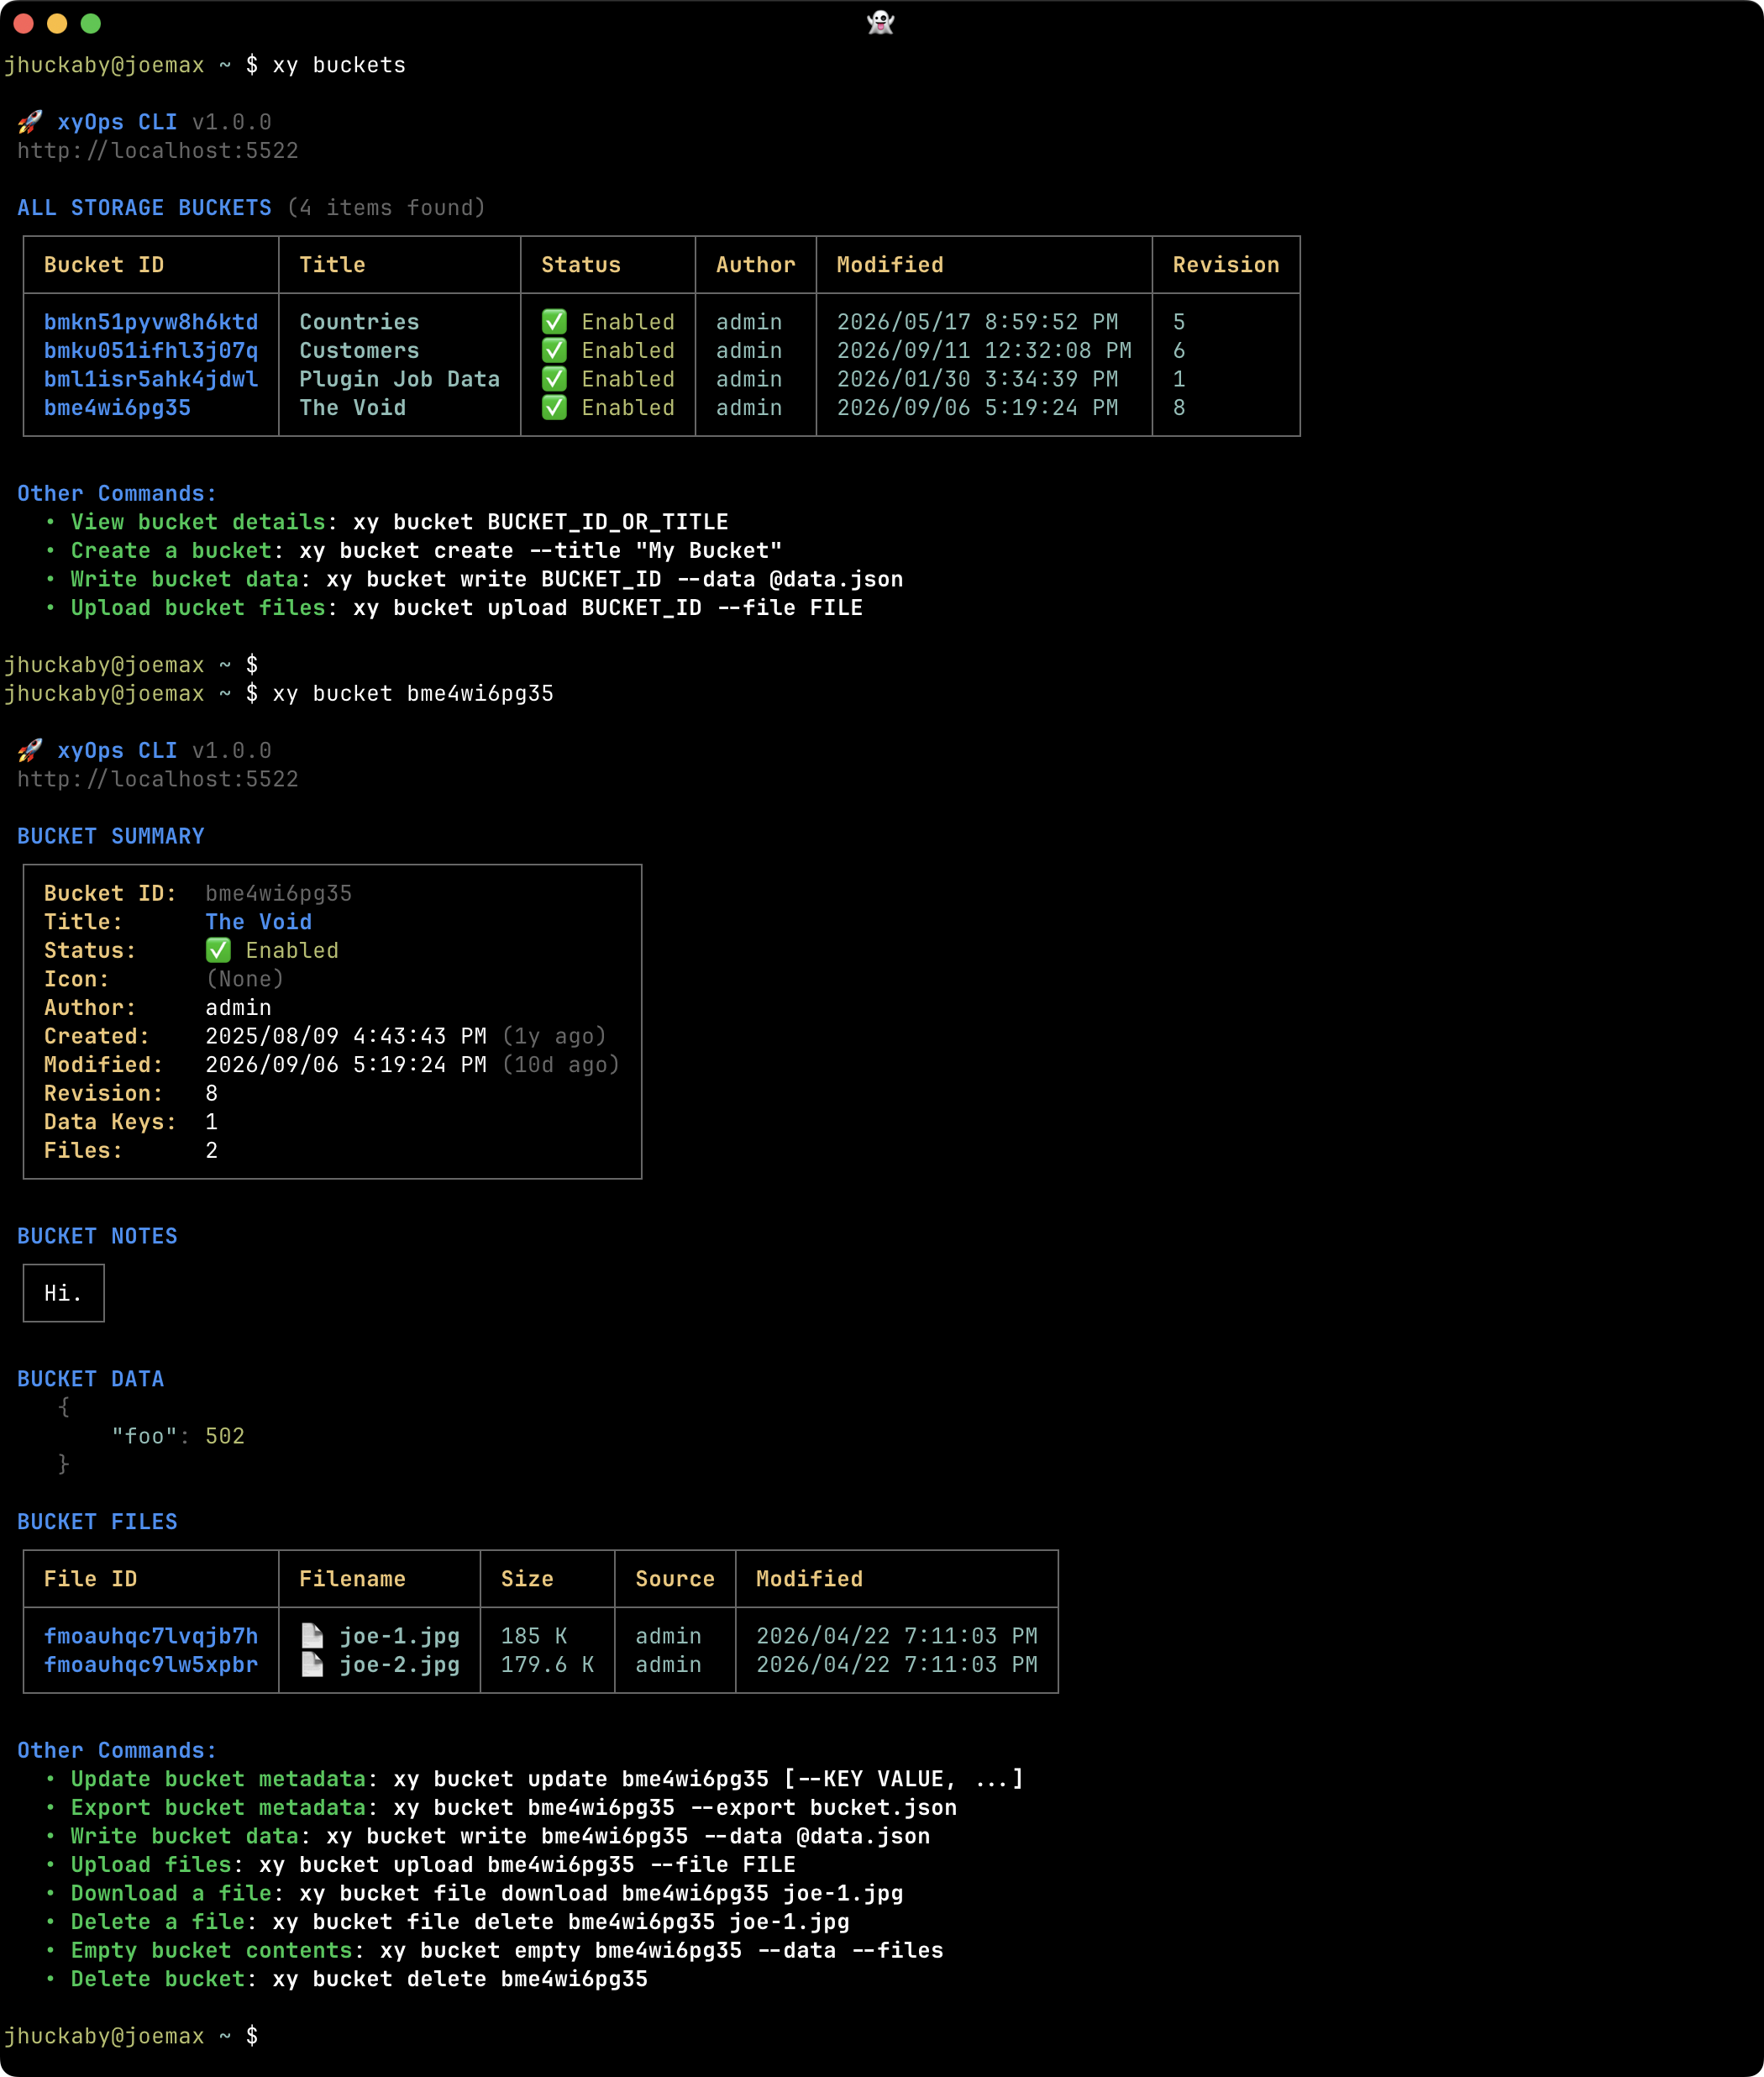
Browse durable storage and inspect the JSON data and files shared by jobs and workflows.
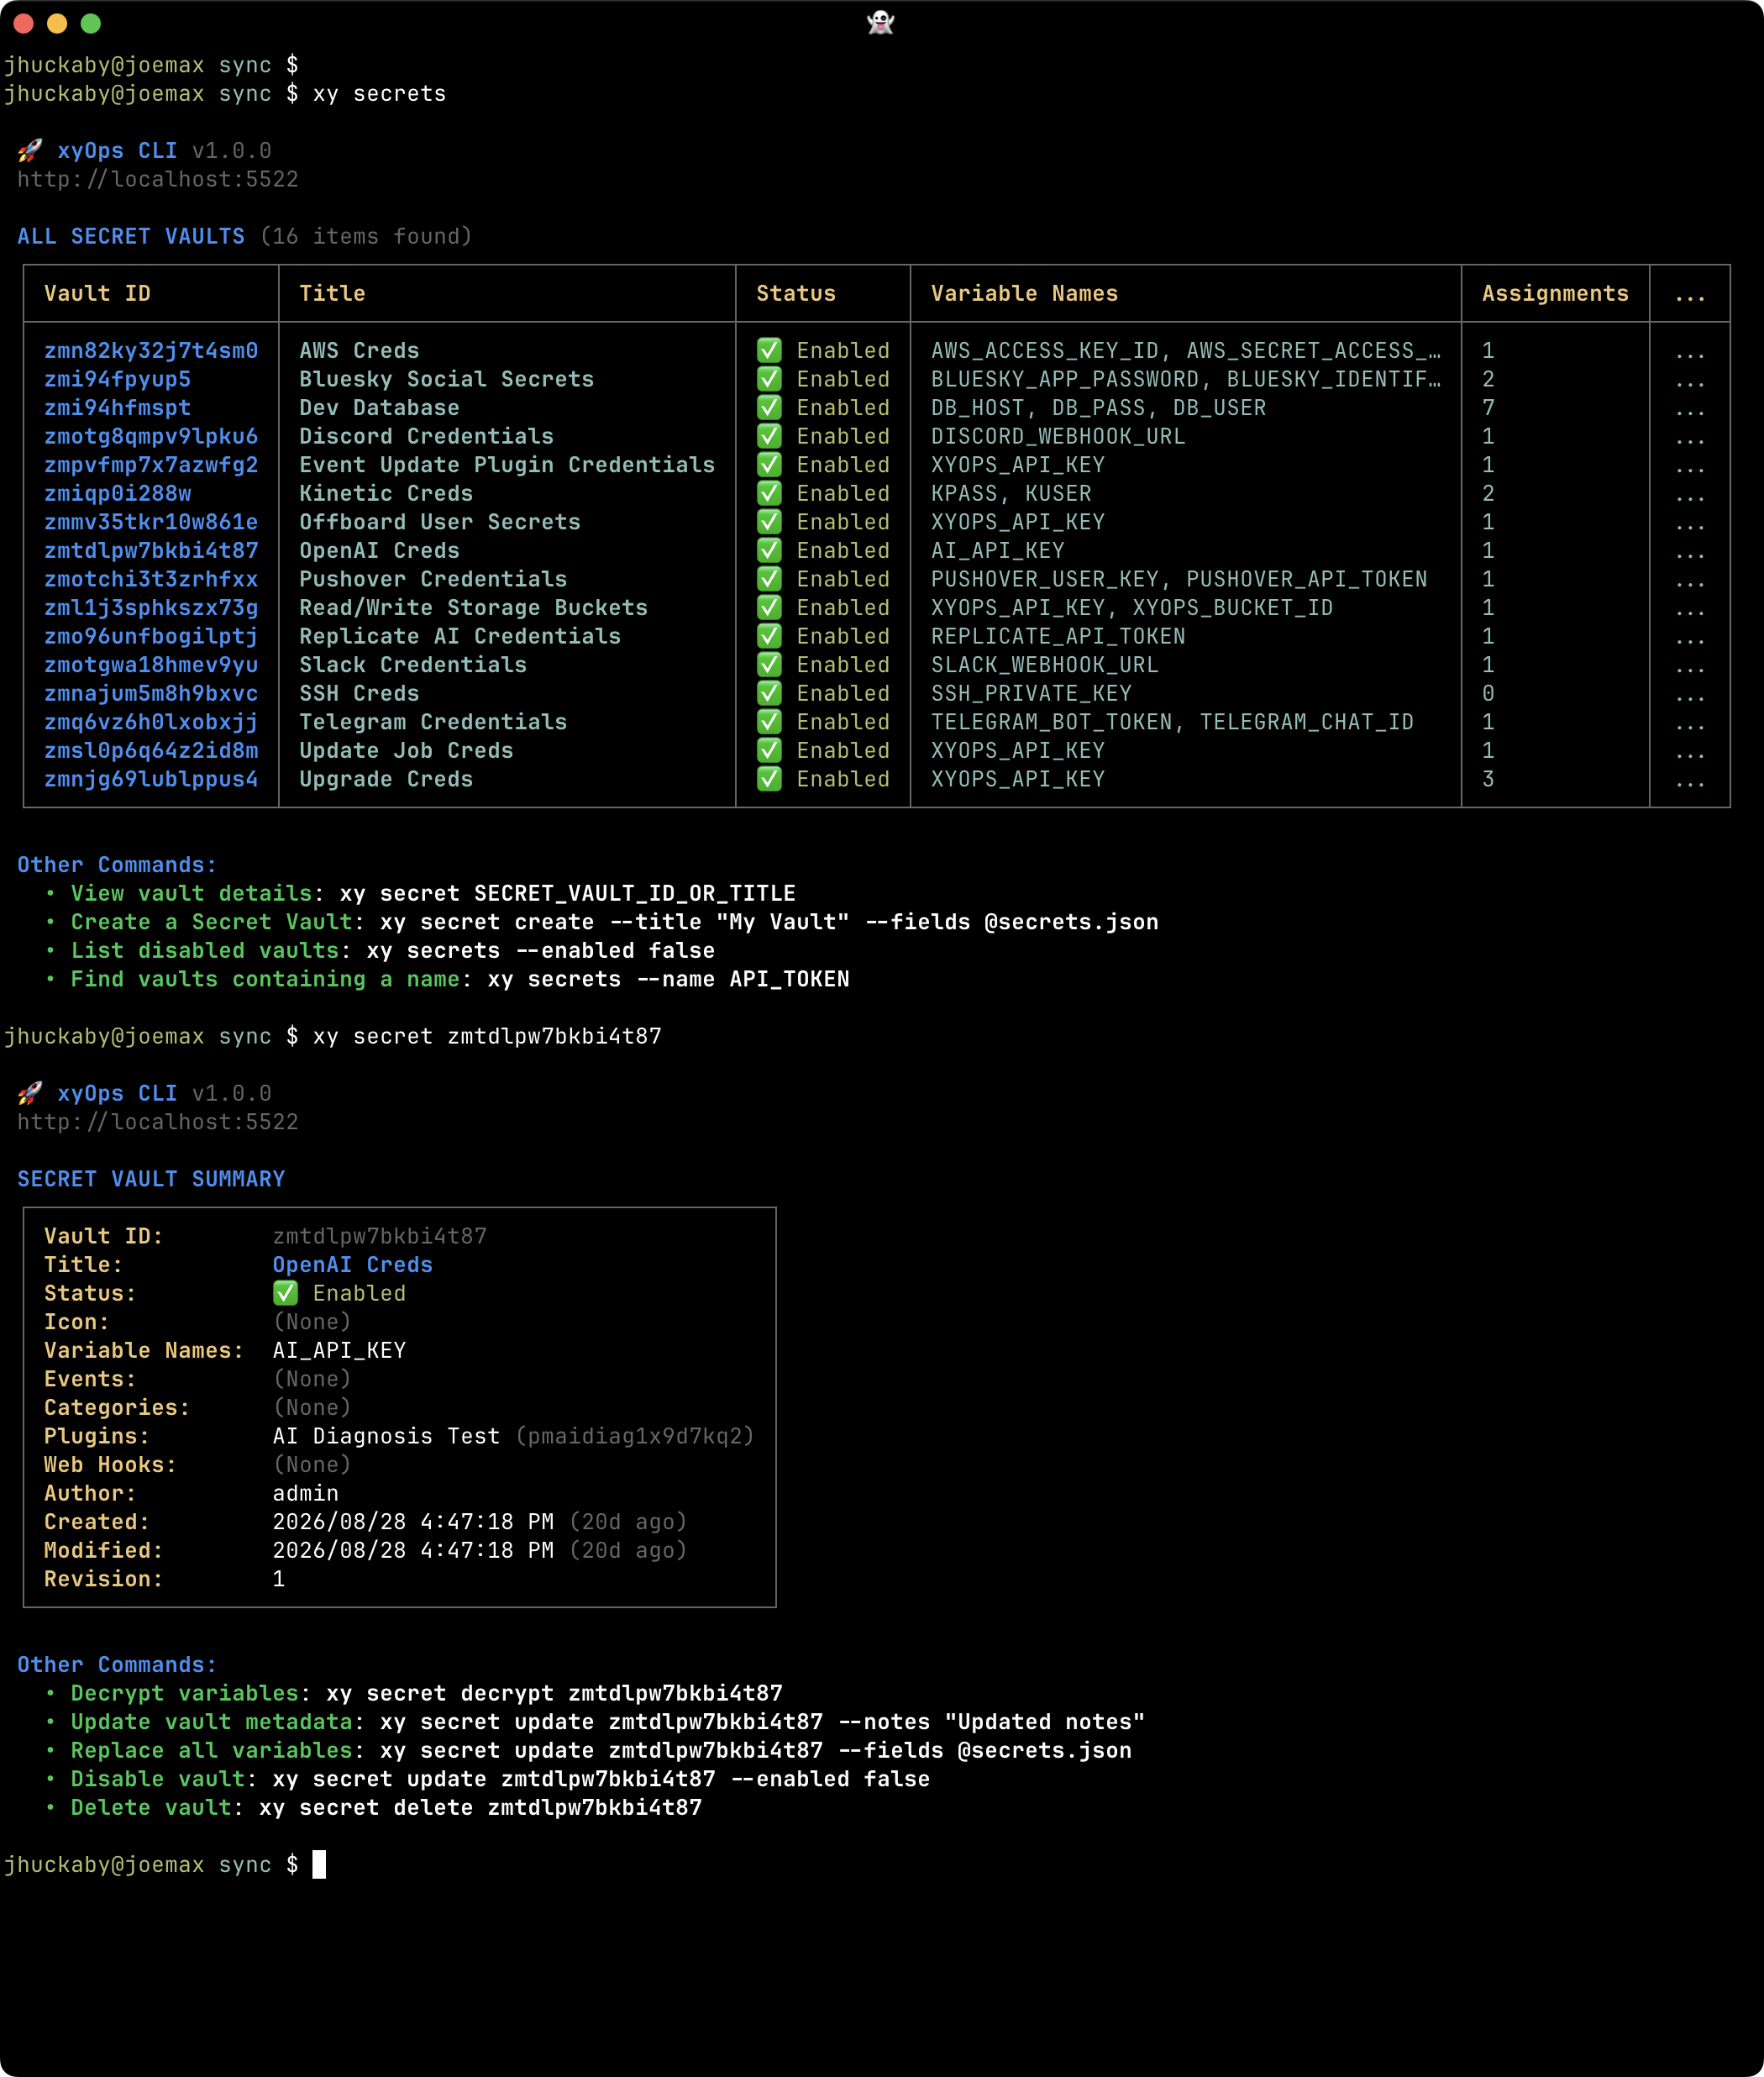
View variable names and Vault assignments while keeping secret values out of normal reports.
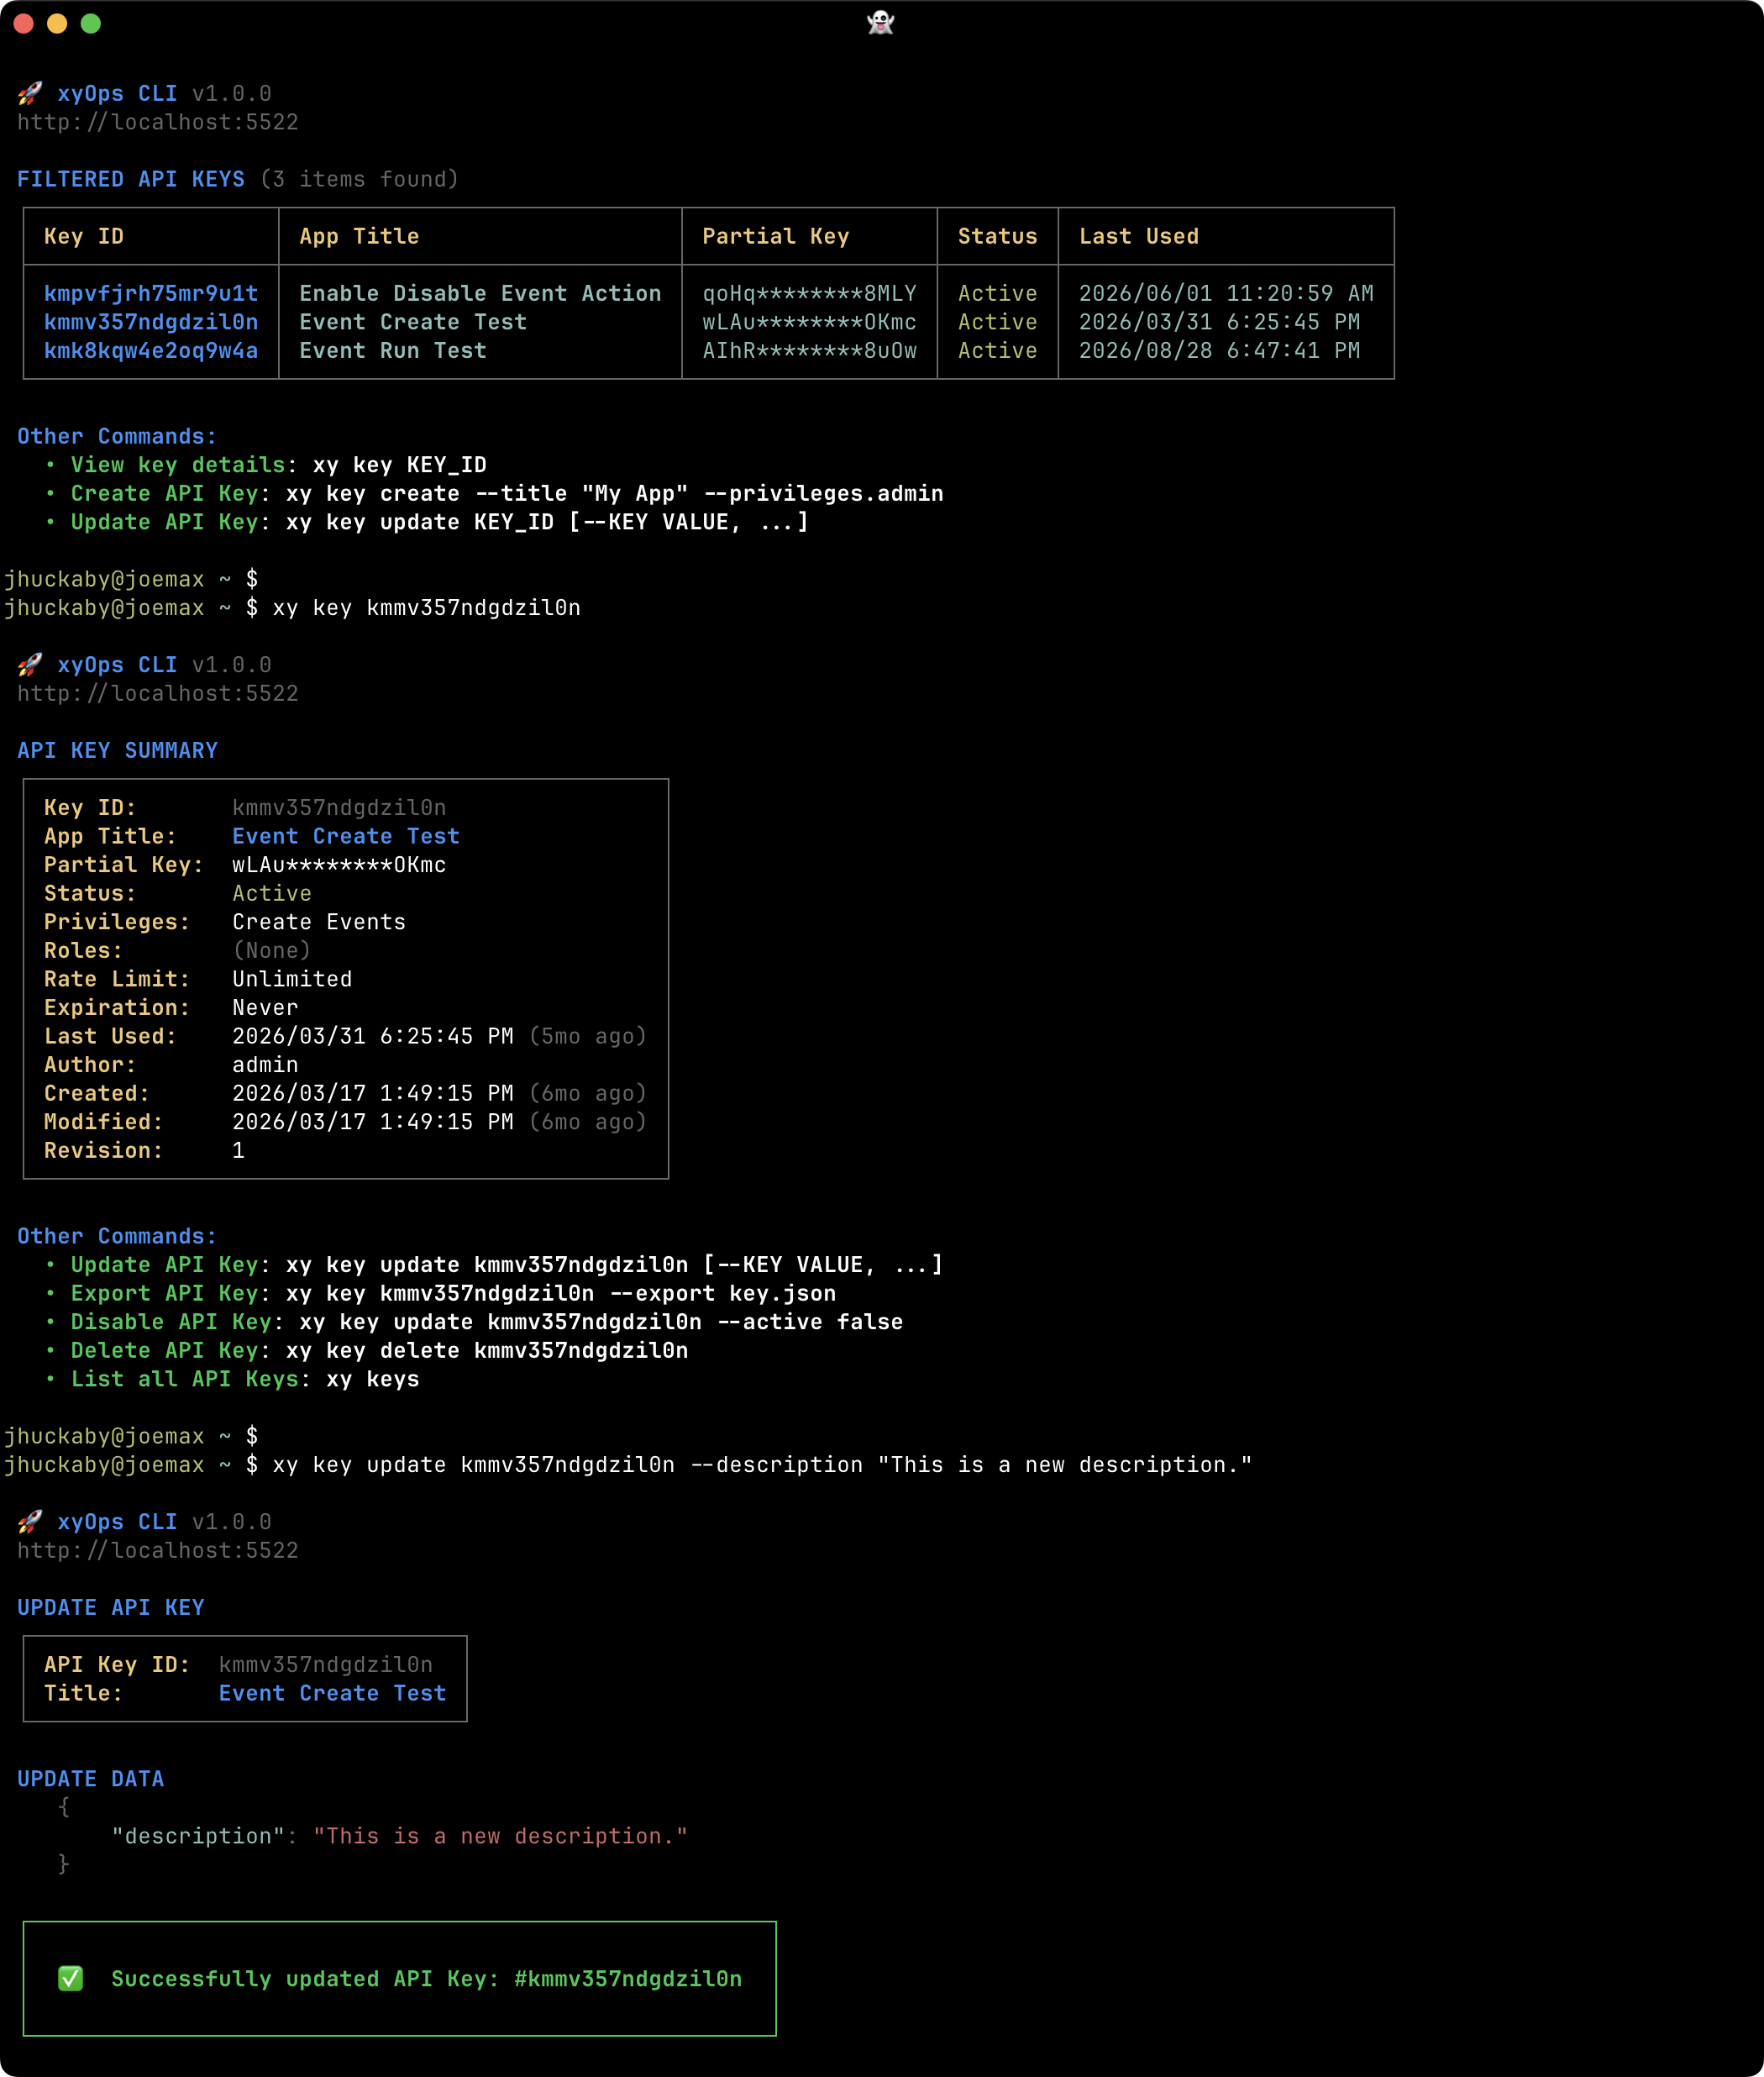
Inspect key status, privileges, and other access settings using safe metadata.
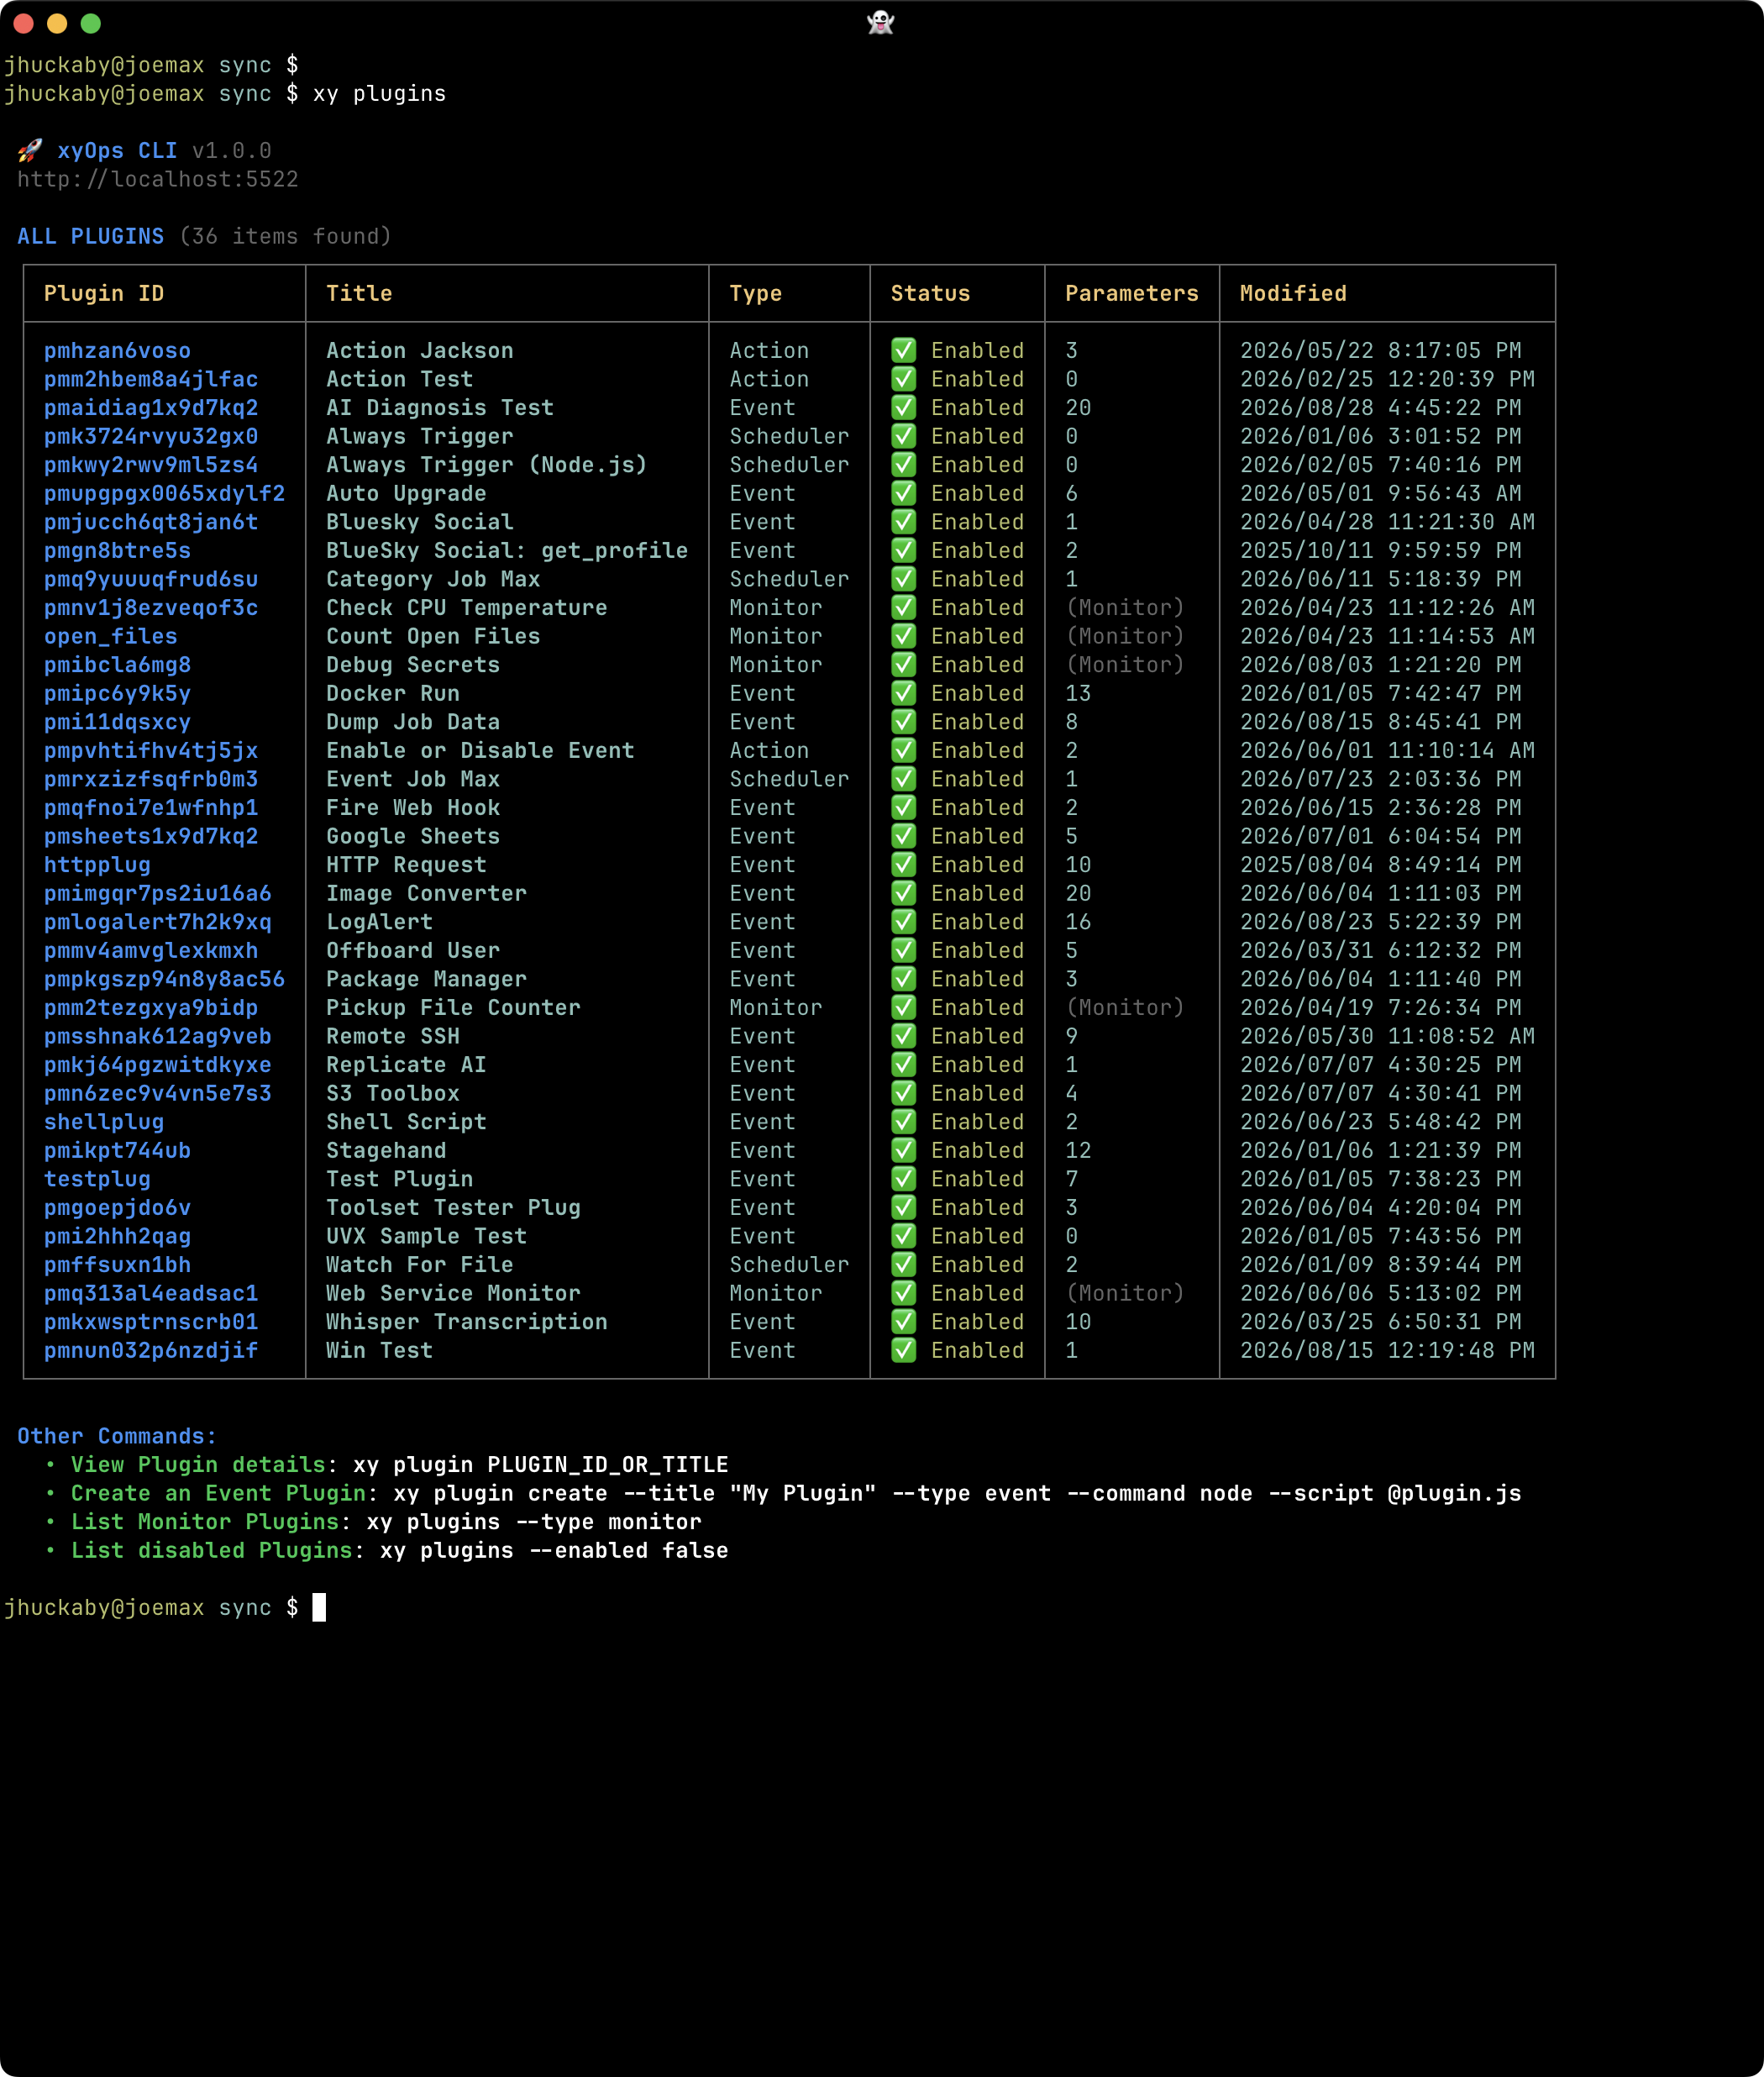
Browse the Event, Monitor, Action, and Scheduler Plugins available to your automation.
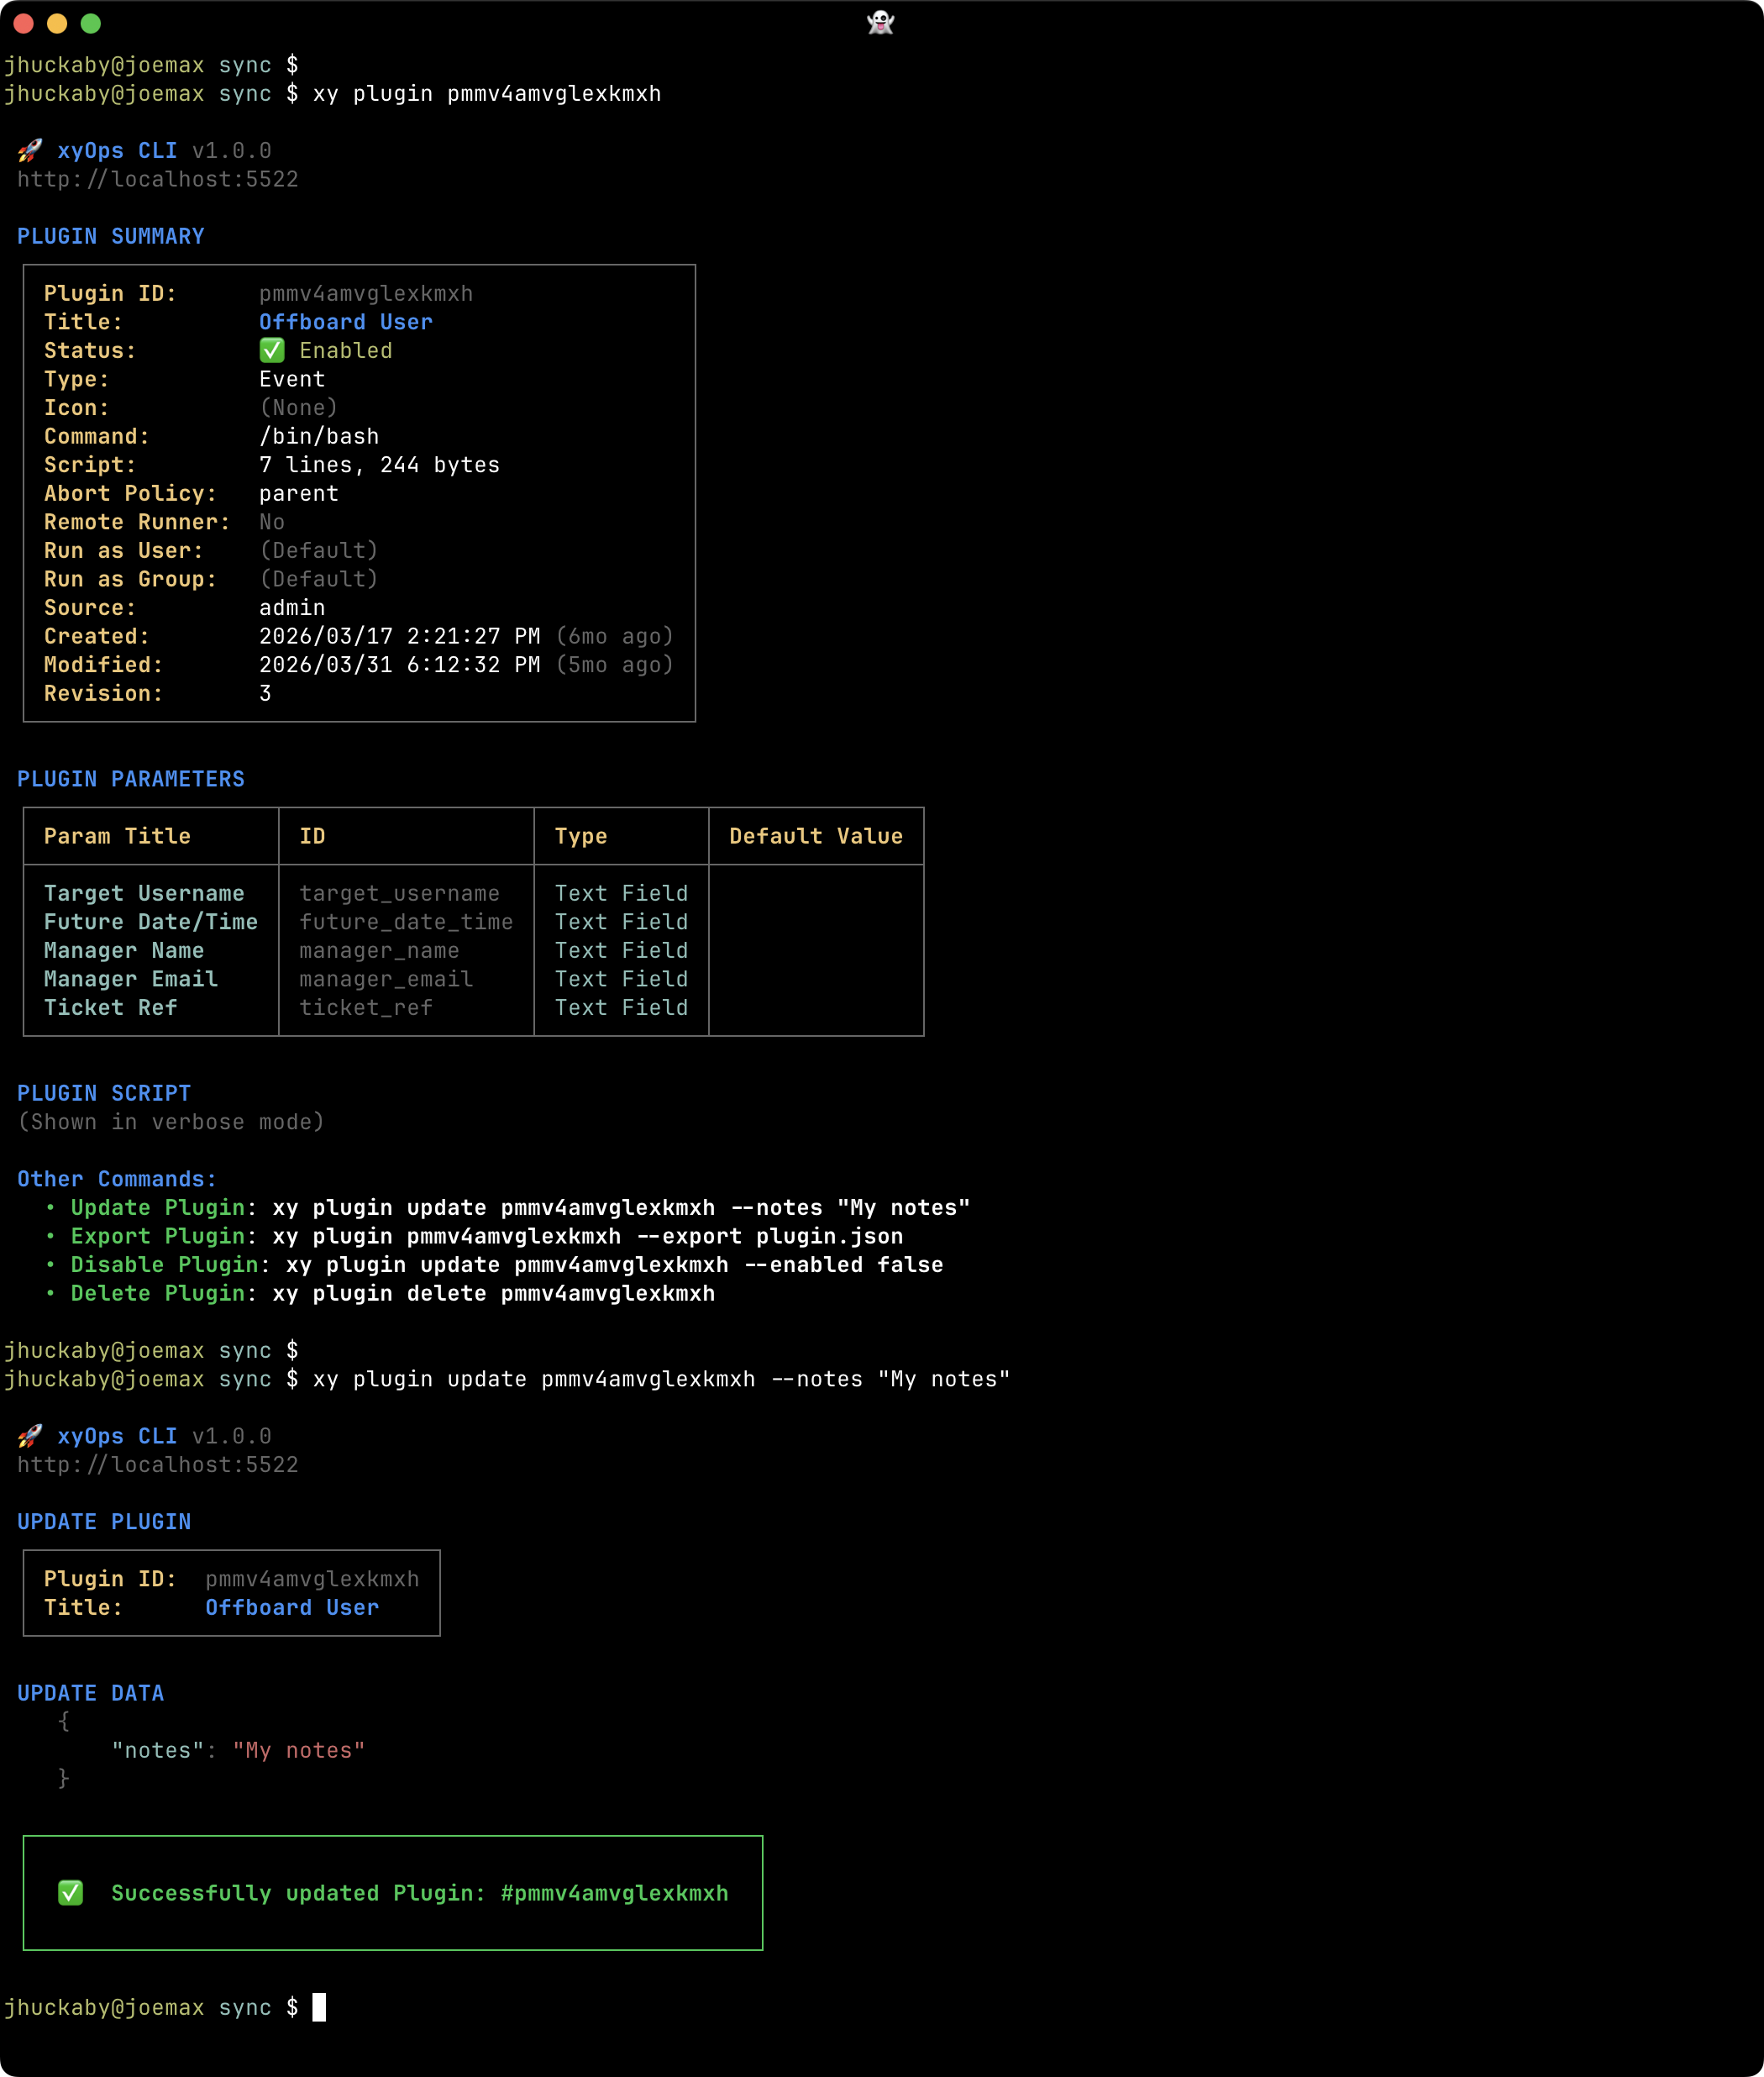
Inspect a Plugin's executable and parameters, then update its definition from the CLI.
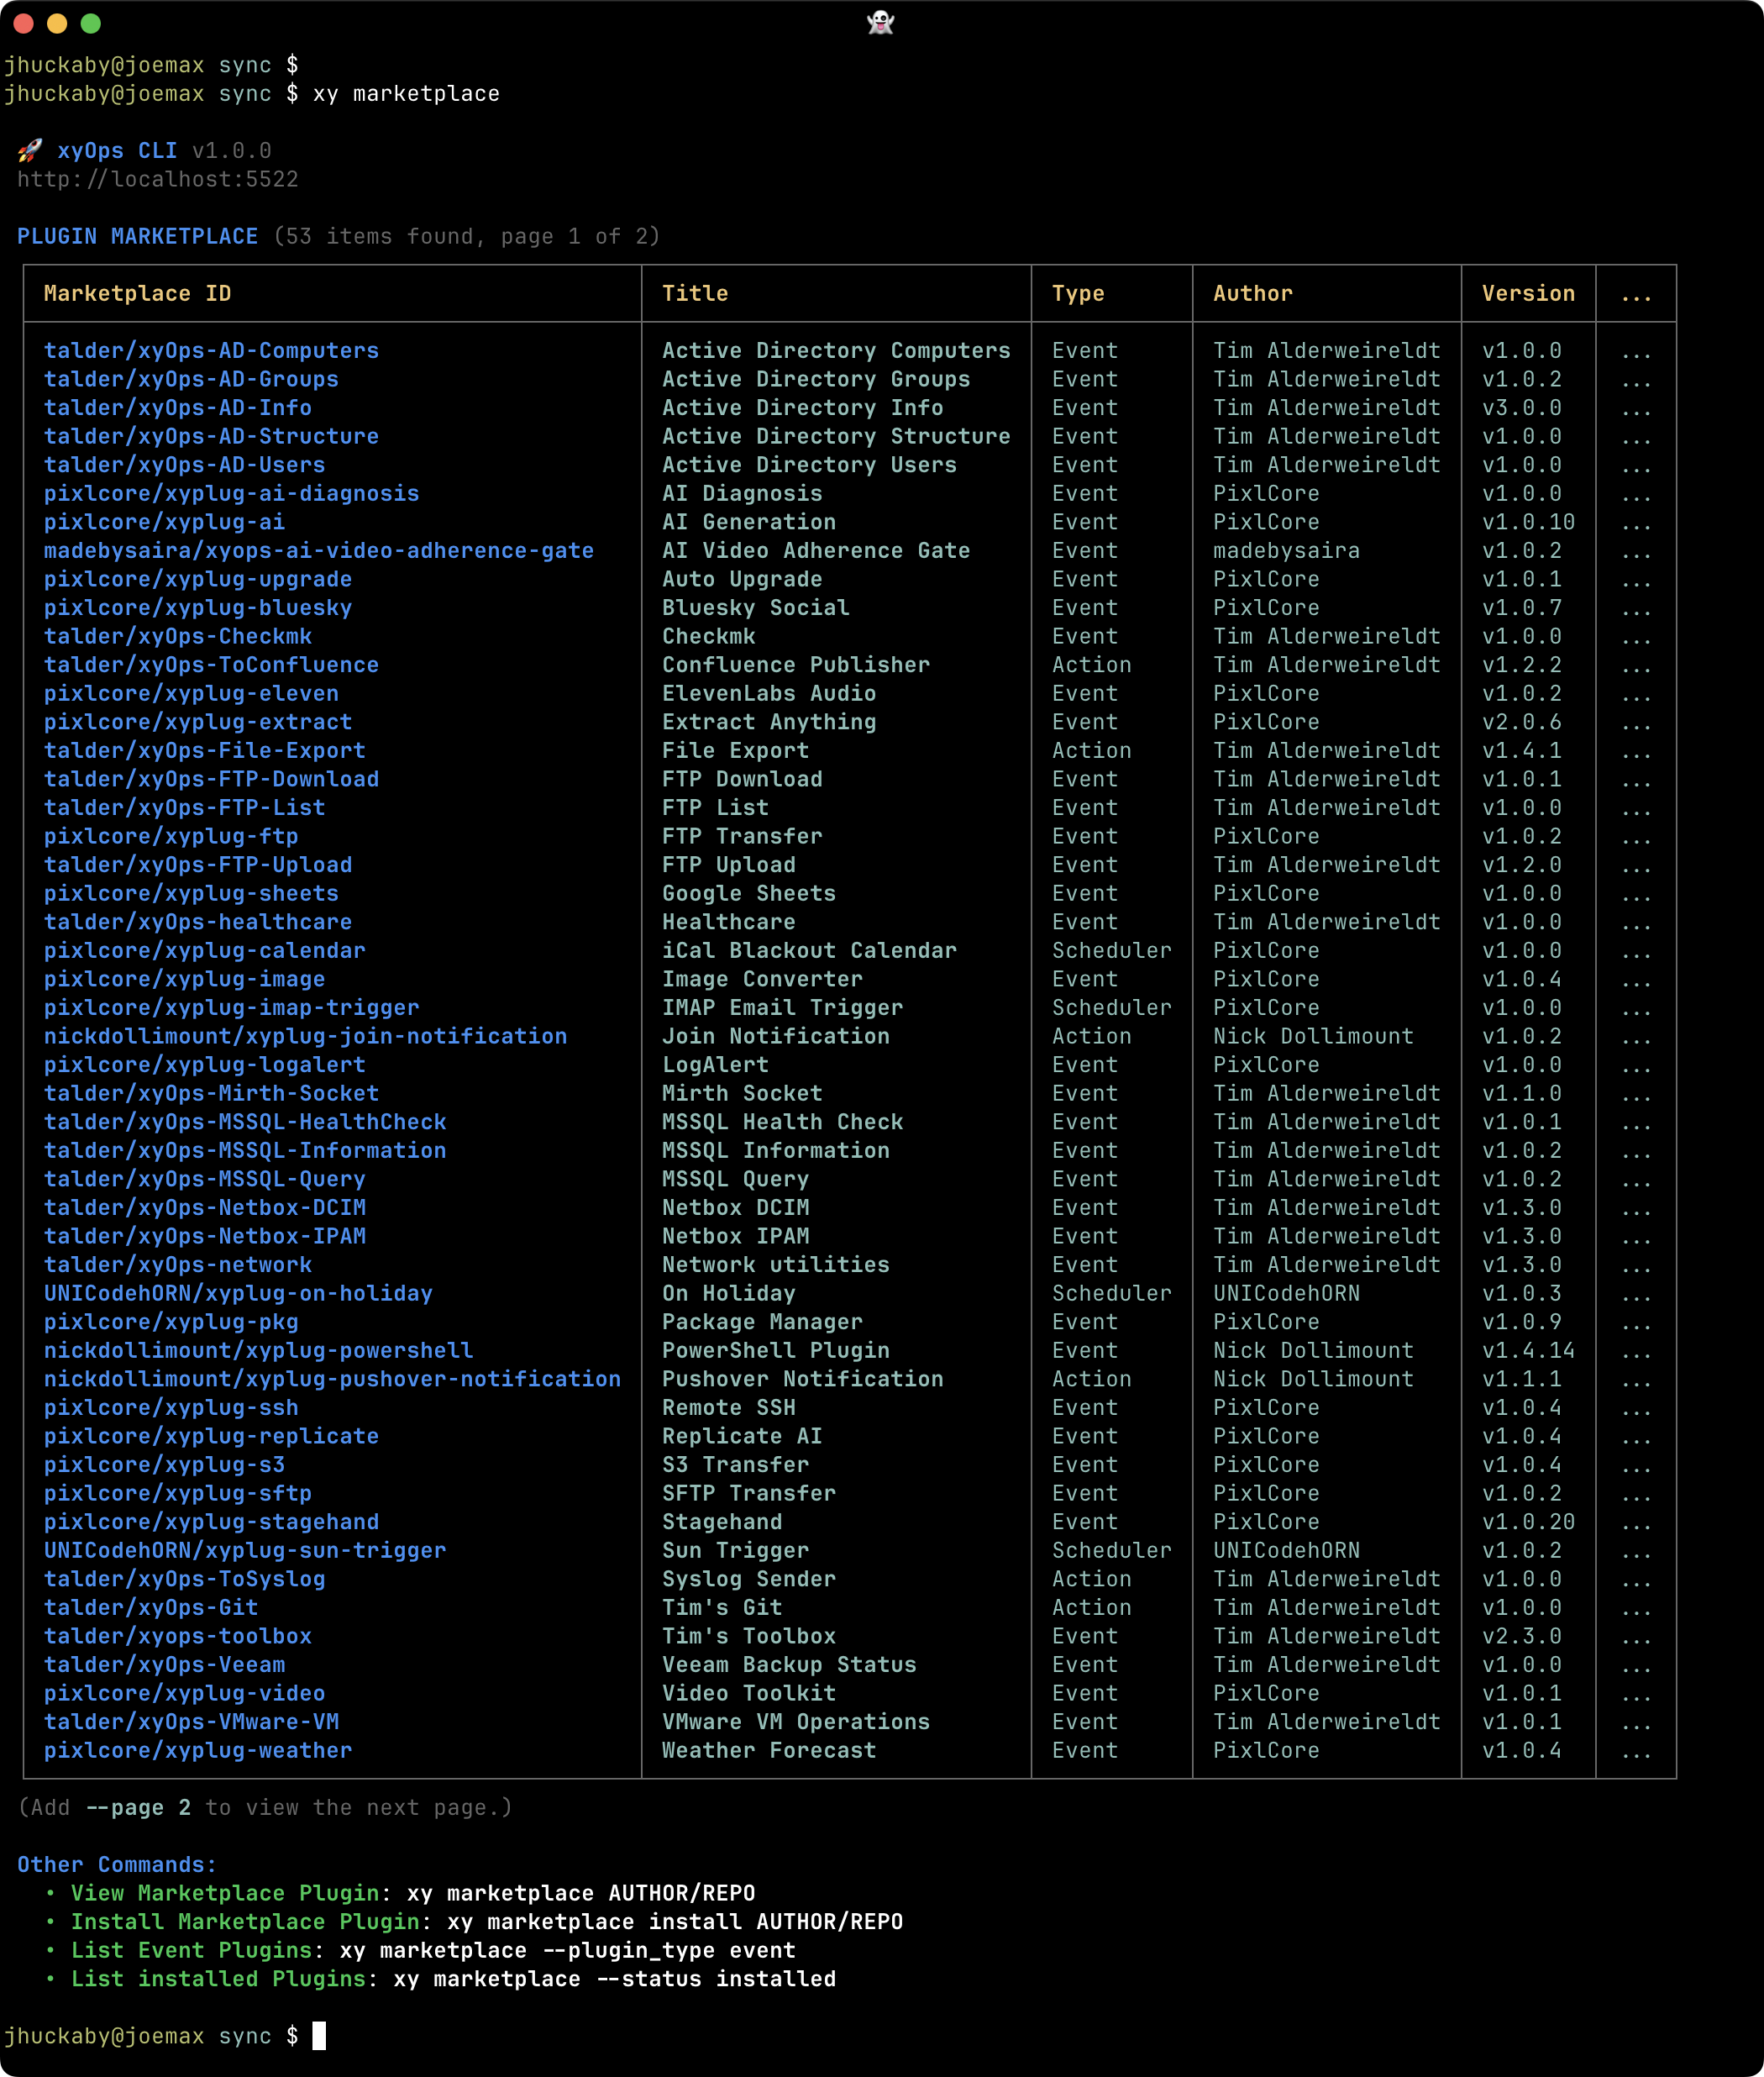
Discover Plugins and compare their types, authors, requirements, and installation status.
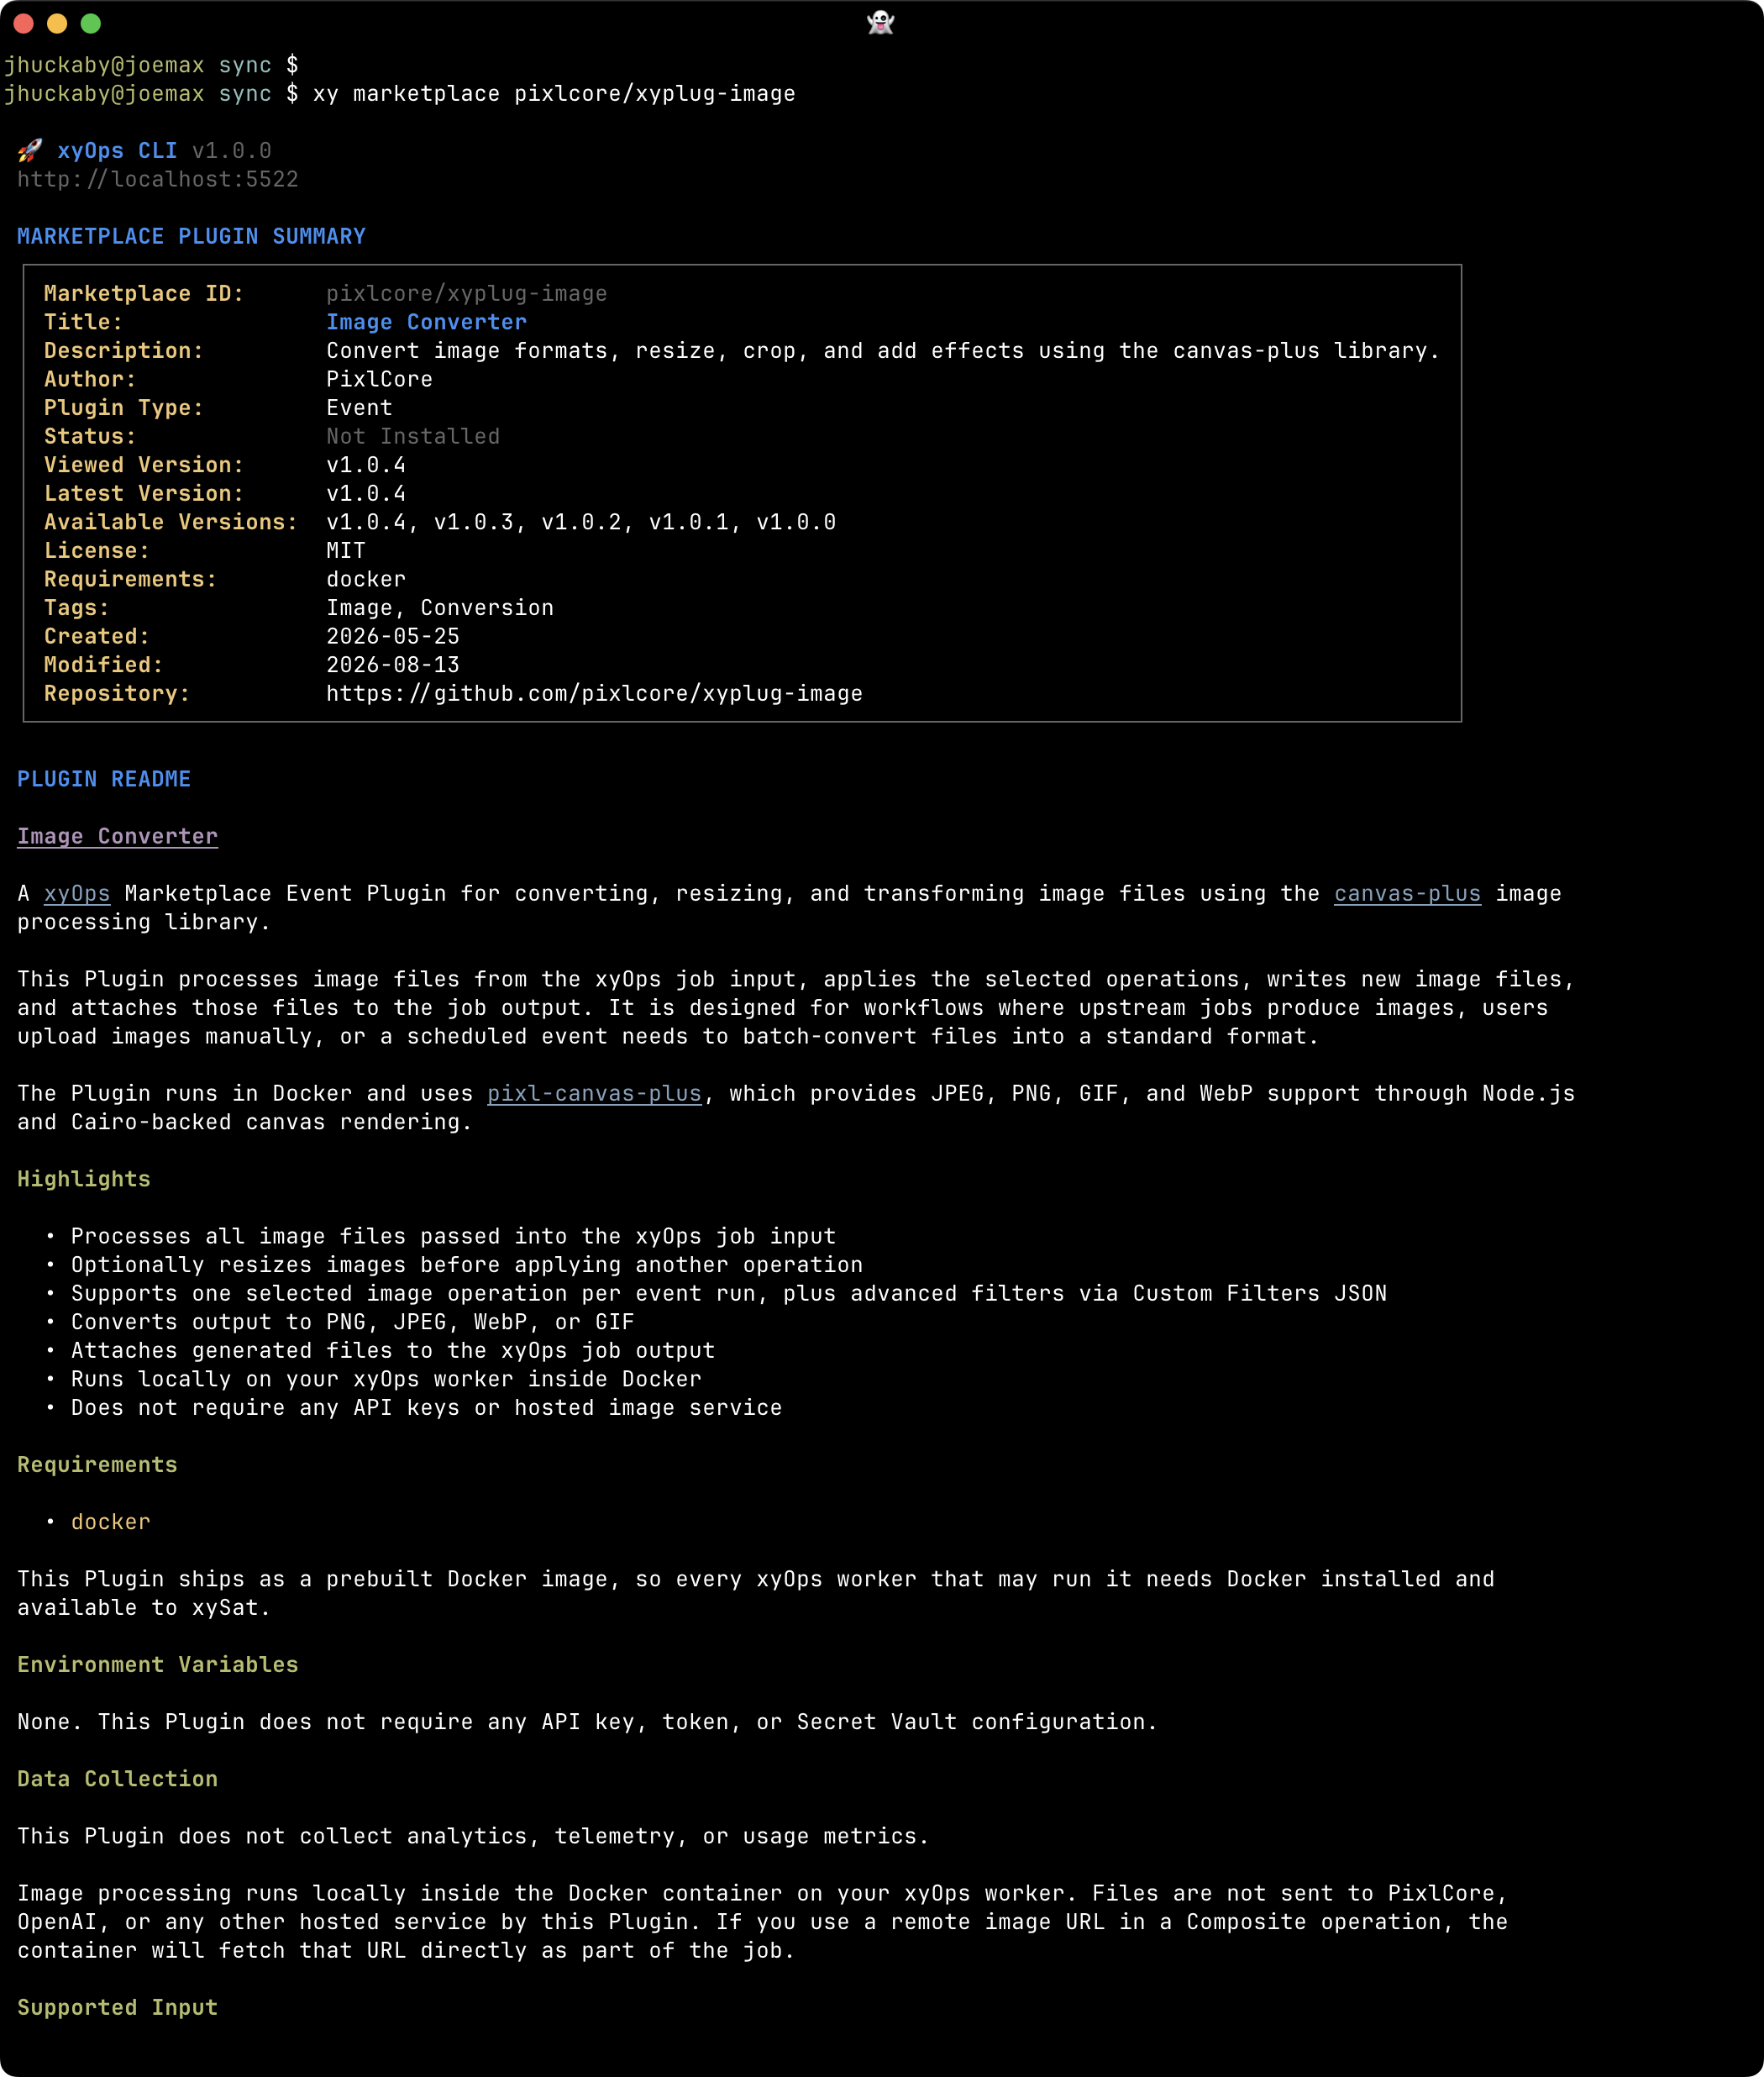
Read a Plugin's description and rendered README before deciding to install it.
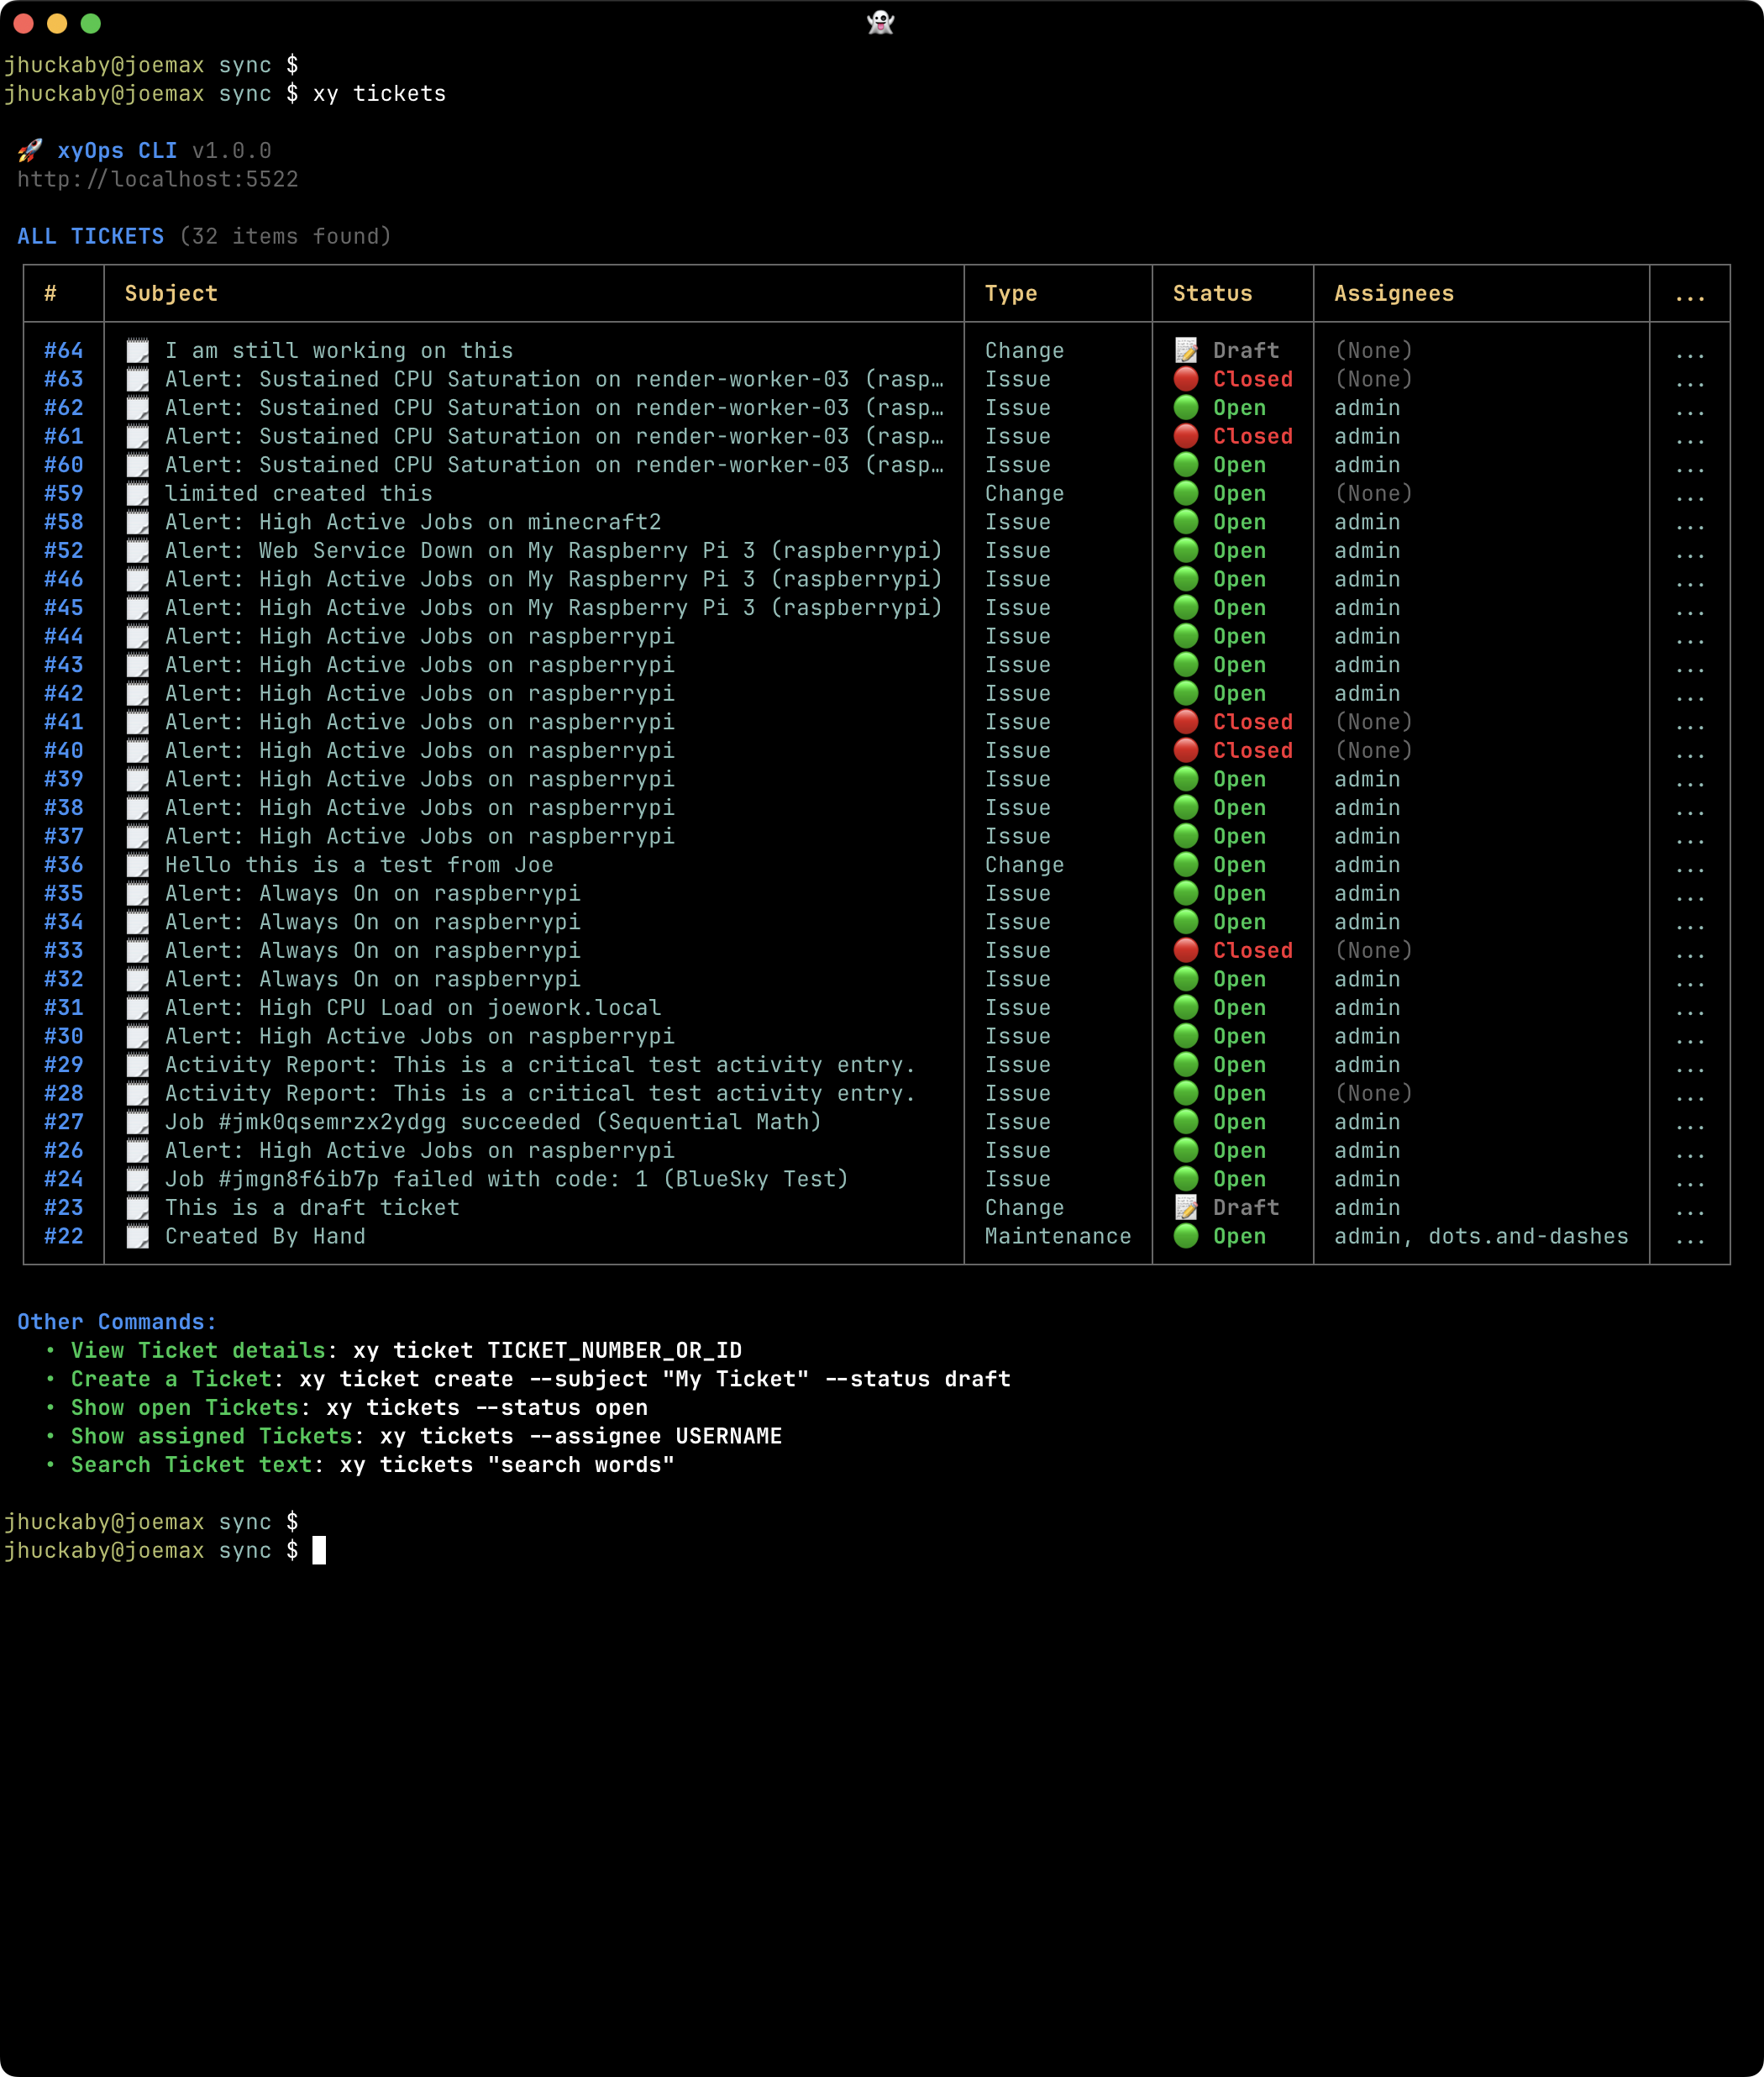
Find operational work by status, assignee, Category, Tags, and other search criteria.
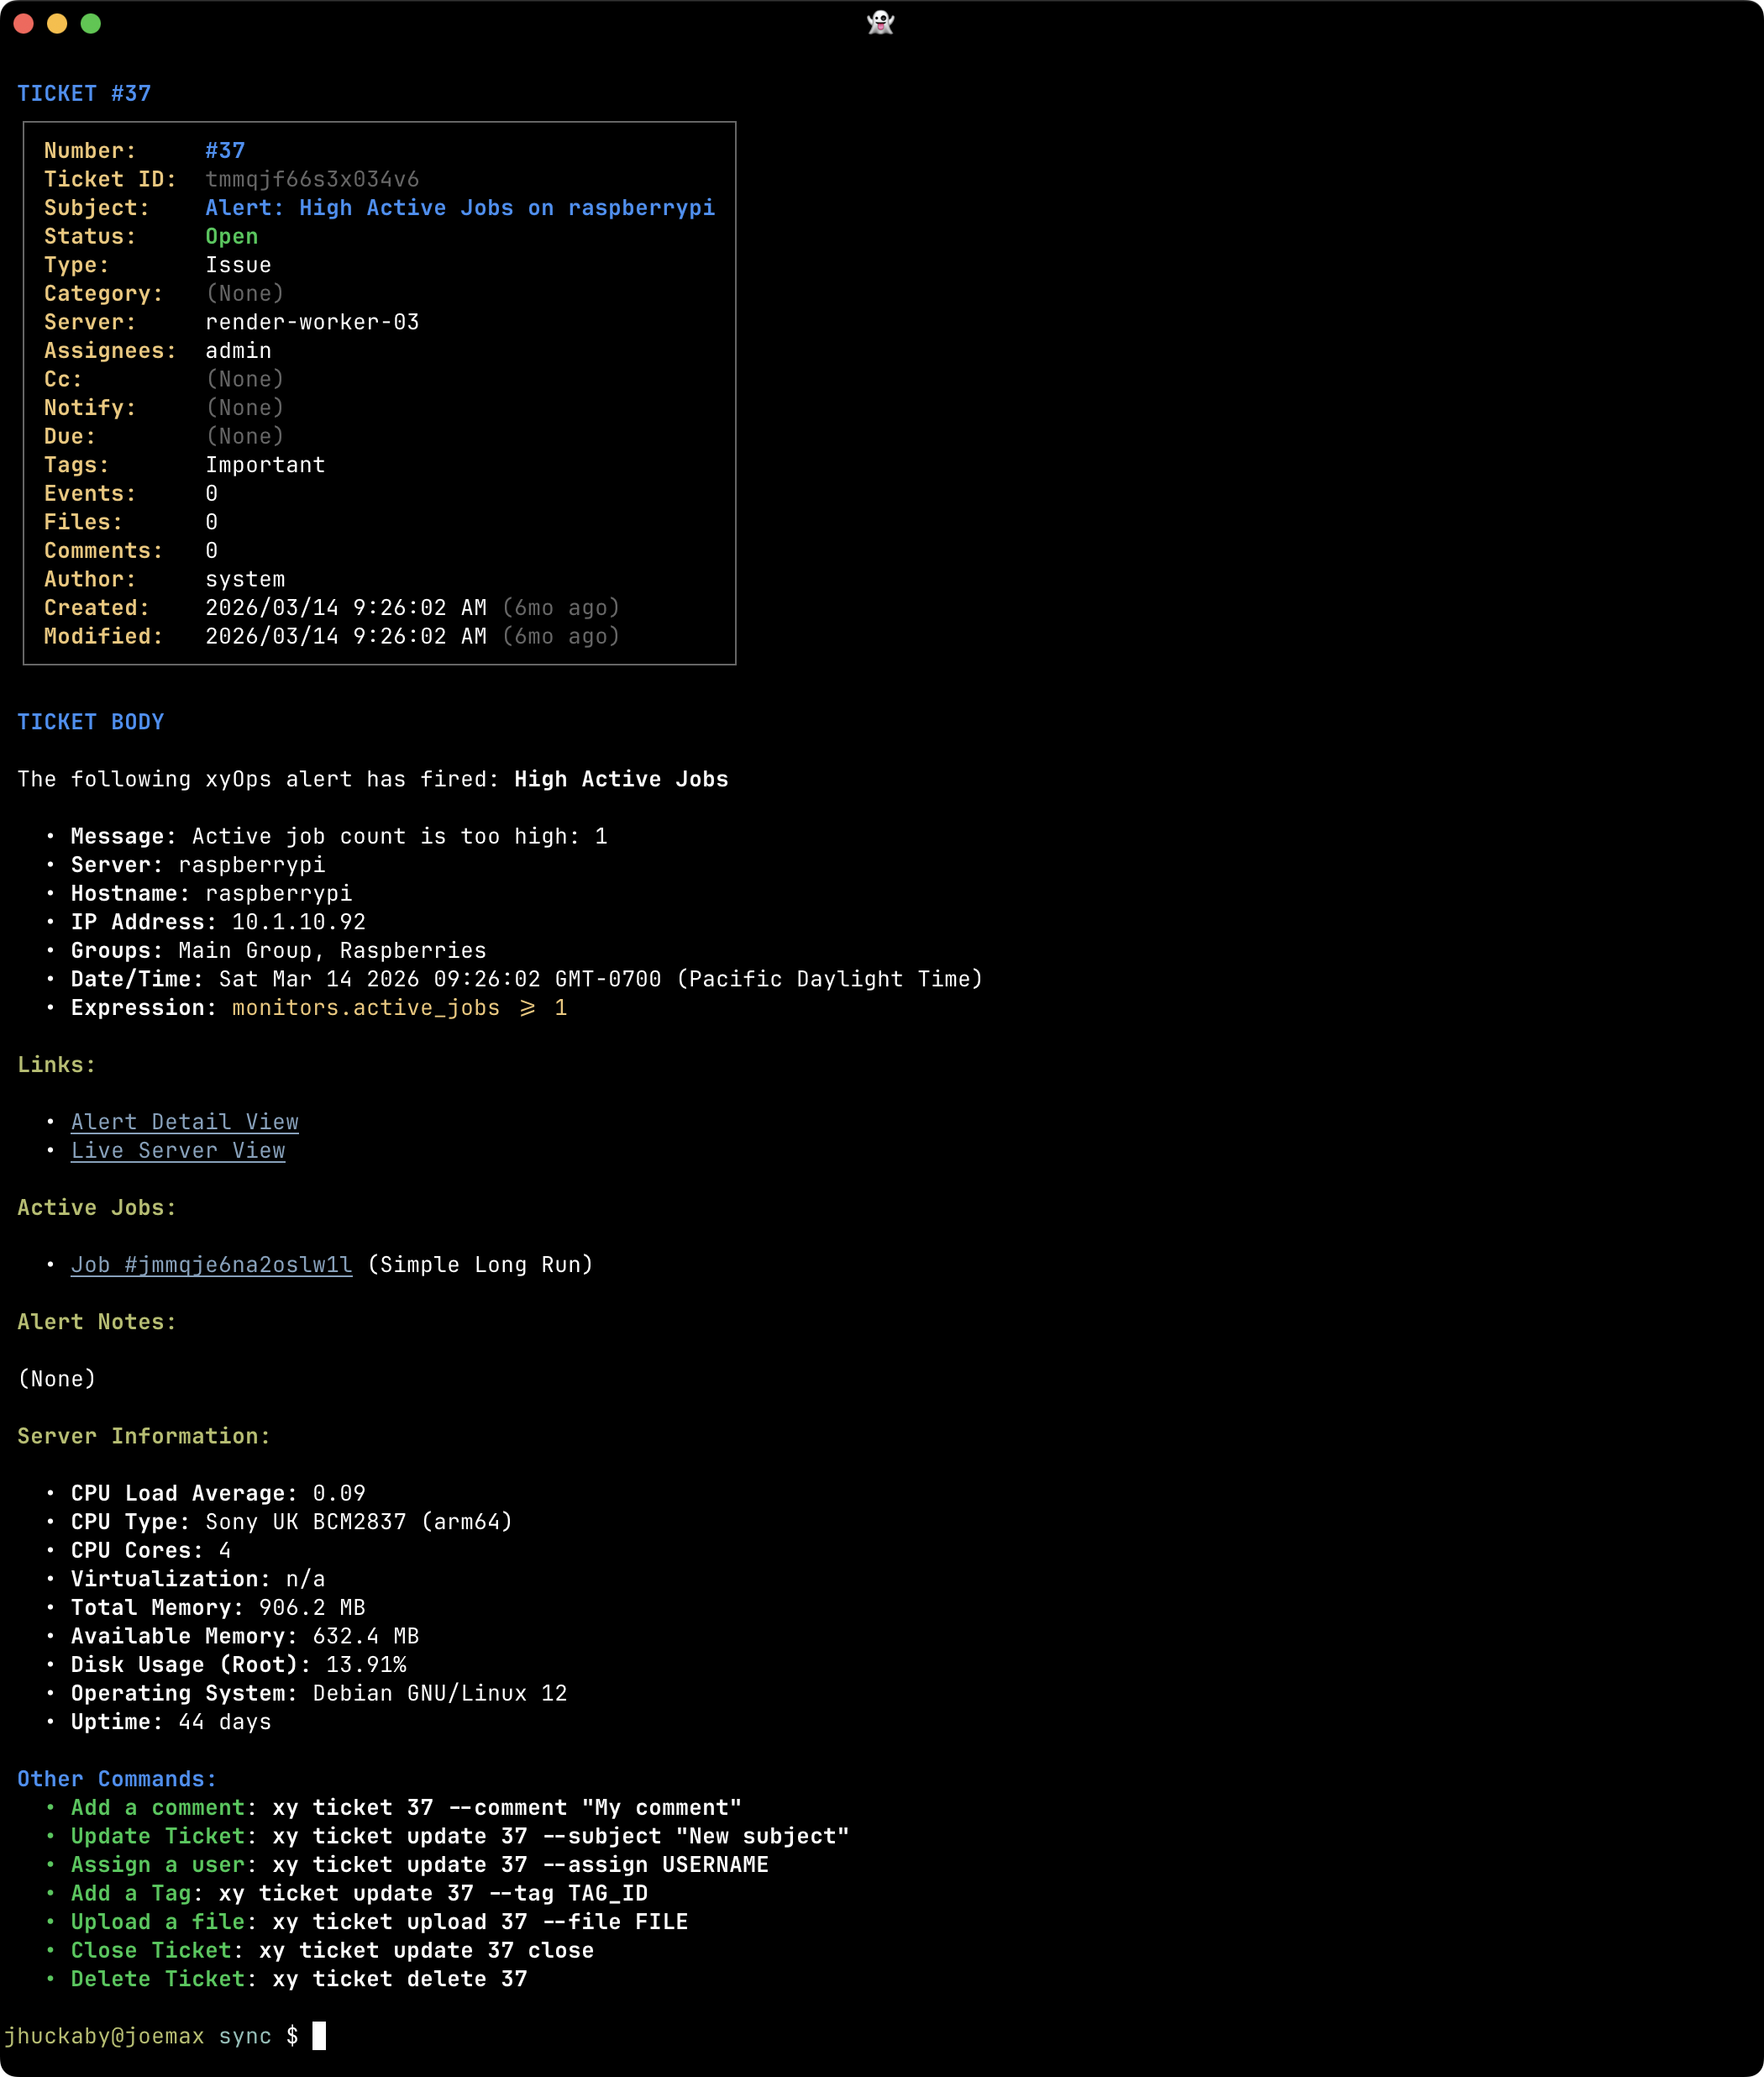
Read descriptions and comments alongside attached Events, jobs, and files.
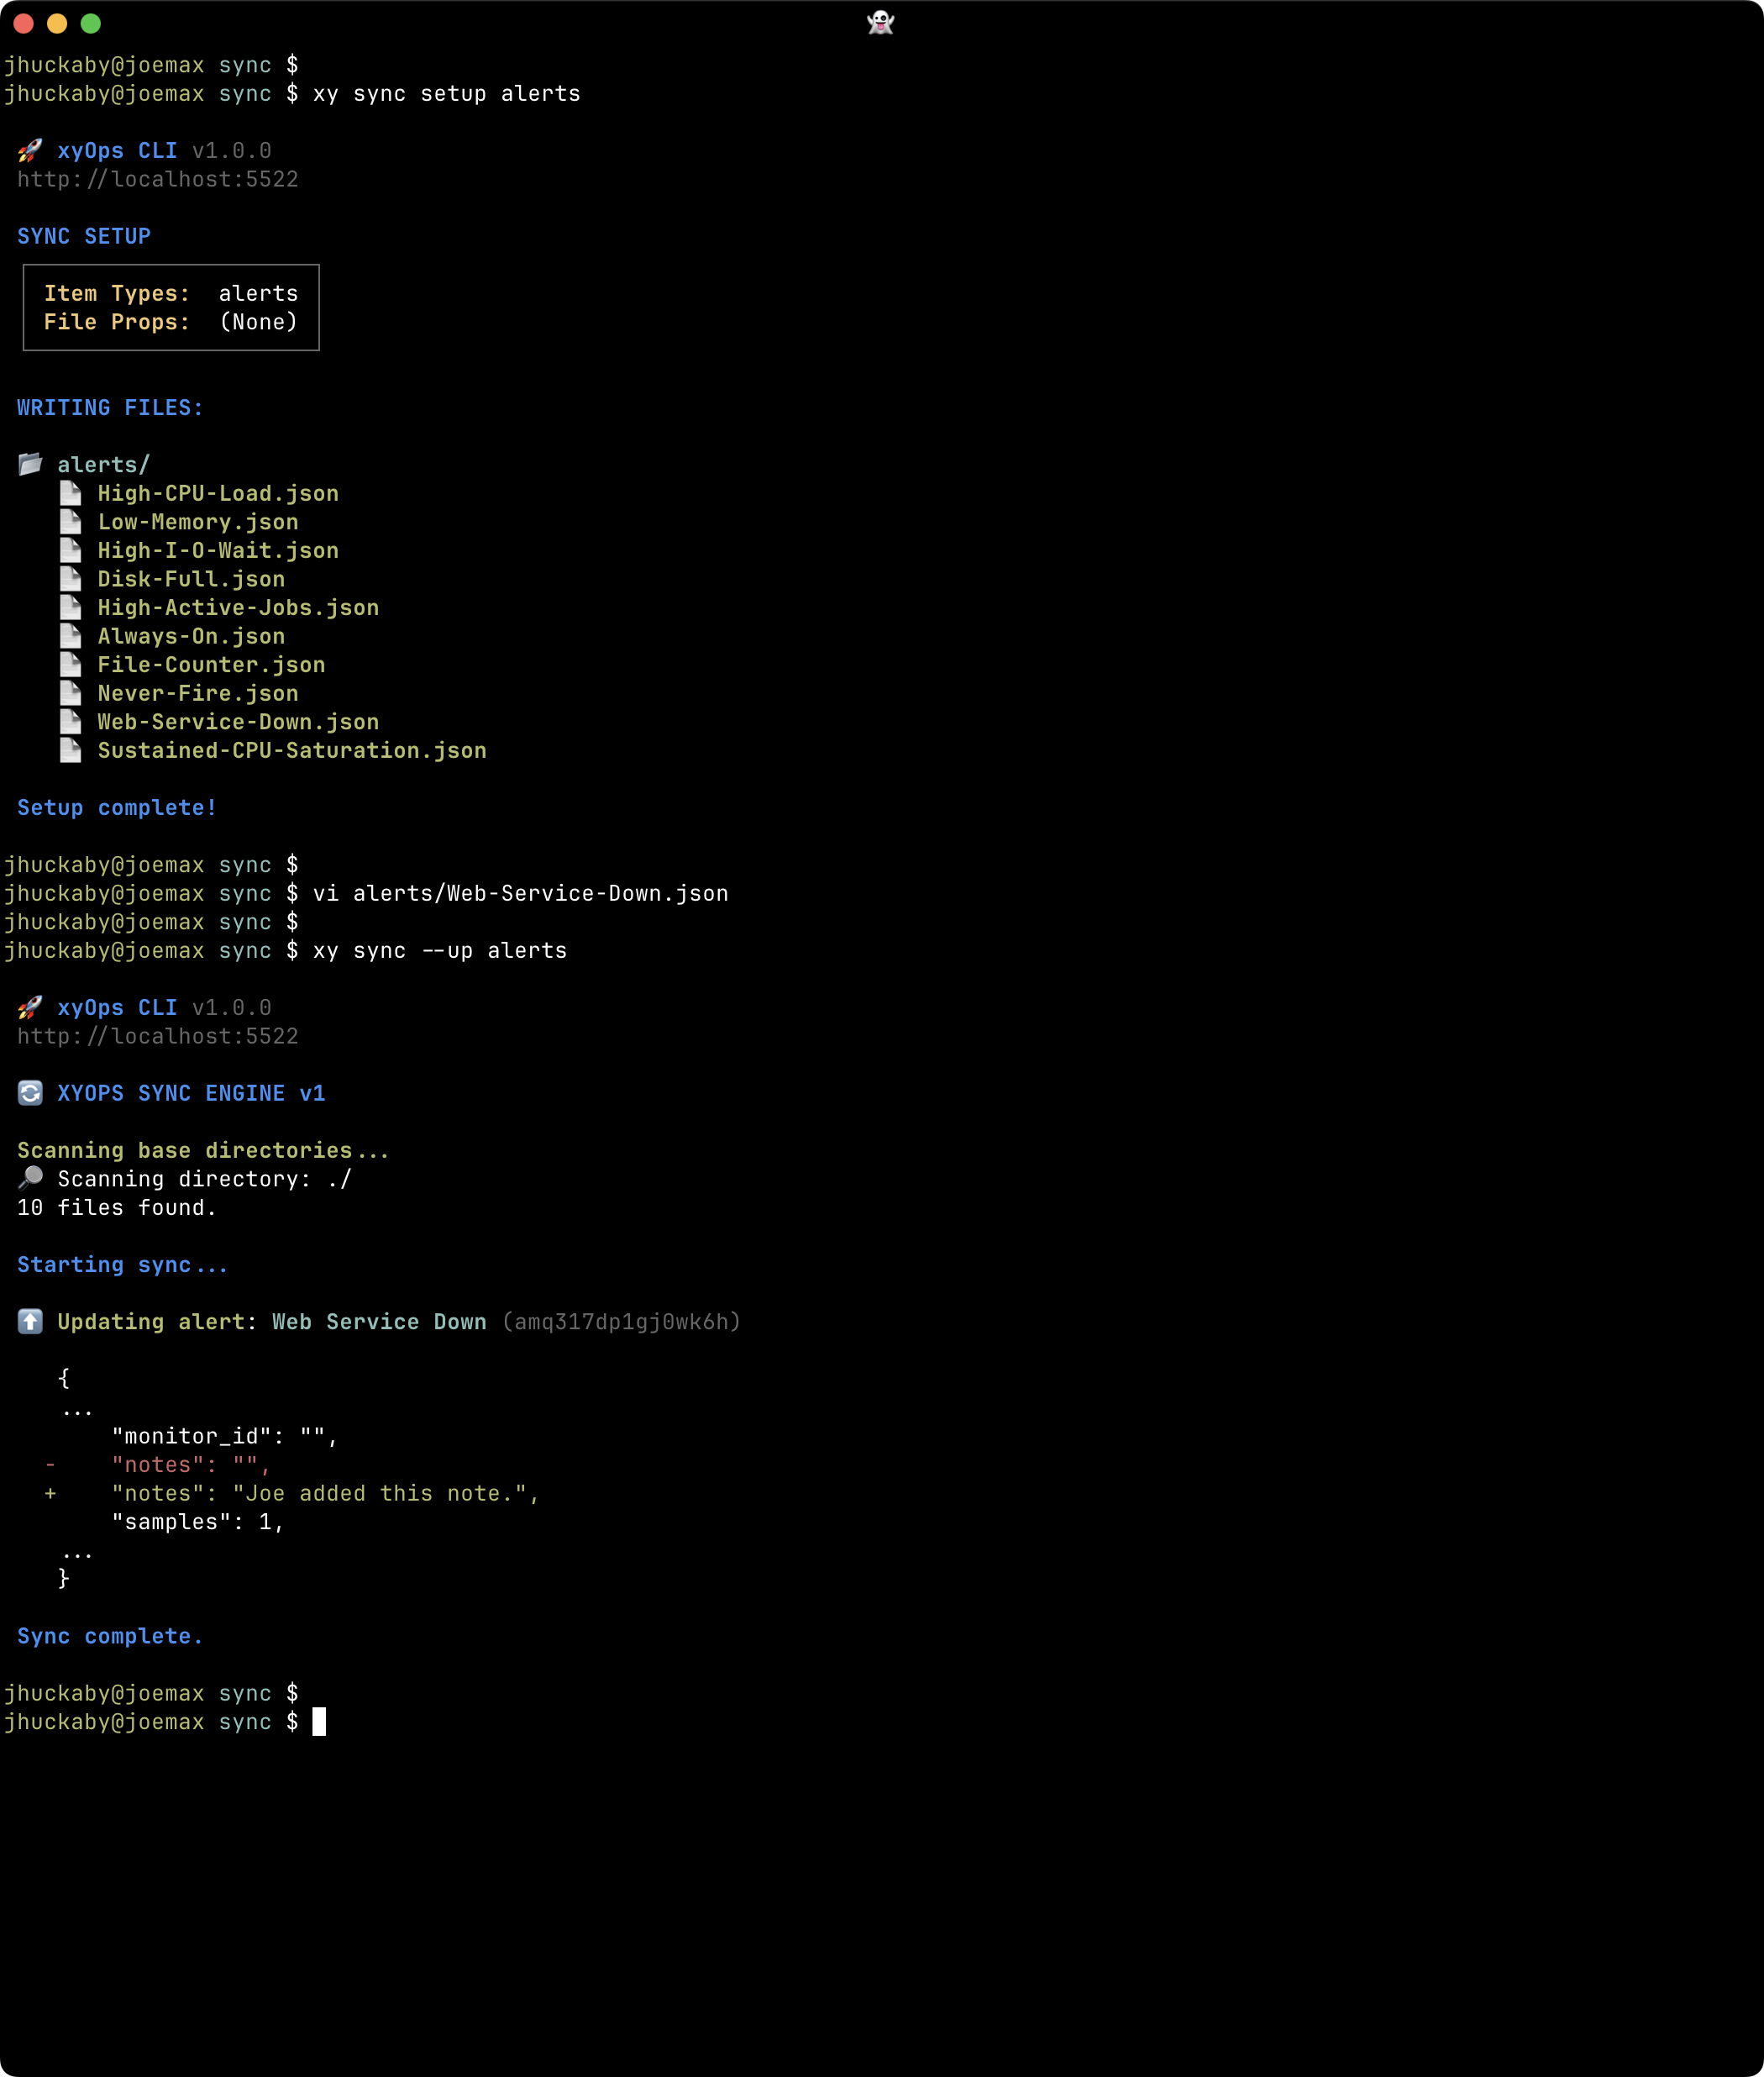
Review changes between local definition files and xyOps as part of an editor and Git workflow.
See the Sync Guide, sync overview, and sync command reference.